Van Westendorp, P (1976) “NSS-Price Sensitivity Meter (PSM)- A new approach to study consumer perception of price.” Proceedings of the ESOMAR Congress.
In this paper we present a new technique for the measurement. The technique is partly based on earlier research in this field but incorporates important new features. The approach is essentially psychometric.
The technique is presented in detail, and a number of applications show that it works and how it works. In general it is said, that the technique might be especially important to researchers at the present time because of the more central role played by pricing-strategies as part of the marketing-mix, and the scarcity of practical instruments in this field.
Introduction
Although most of the handbooks on marketing tell the marketing manager that “price” is an important component of the marketing-mix, the theoretical attention paid to “pricing” is certainly not reflected by a wealth of techniques in the field of marketing research. For instance, in an important handbook like Worcesters (1), one discovers only 3 pages (of the 660) devoted to pricing-research, and in those only the pricing of new products is briefly discussed. In some texts the treatment of “pricing-research” is often limited to a discussion about price-analysis in economics.
The market-researcher who is confronted with one or several of the many valid questions which could be asked about consumers perceptions of, and reactions to, prices has almost no tools at his disposition to solve the problems in this field, in particular when an ad-hoc survey is planned.
Market-researchers have developed a number of attitude-scales on “price-consciousness”. With those the consumers can be grouped in a satisfactory way. But what is the meaning of price-consciousness in a certain field in a quantitative sense? At which reduced price is the “price-conscious” consumer going to react to a special offer? Such questions cannot be answered with the techniques at our disposal.
Yet, under the present economic conditions, the importance of pricing and thus of pricing-research is certainly on the increase. We shall not discuss the various factors which influence this shift in emphasis – it is sufficient to remark, that the researcher of our days is much more confronted with questions about pricing and much less with the traditional problems of brand-images which were the fashion in the sixties.
As even market-researchers are sometimes able to detect the “gaps” in their own markets we, at NSS, have been working on the development of a comparatively simple instrument which might answer a number of questions clients come up with in regard to consumer’s reactions to prices, or consumer’s perceptions of prices.
In this paper the technique will be presented and a number of practical examples will be discussed. As many projects with PSM are under way at this moment, we expect to be able to present some new results and a better validation of the technique at the conference meeting.
A word of warning seems to be in order. Market researchers are often prone to a certain over-enthusiasm about a new technique. Often it is confidentially claimed, that now all problems in a field can be solved by a new technique, without doing a careful study of its limitations, the conditions under which it works and the conditions under which it most certainly does not.
We like to emphasise that while believing in the principle of the technique and its practical applicability, much work needs yet to be done, especially of a theoretical nature and in the field of the relation between perception and behaviour.
Marketing research and pricing problems
Earlier Approaches; subject and techniques in general
We shall mention very briefly some of the earlier approaches in the field of pricing-research. We shall limit ourselves to practical marketing-research and we shall not touch upon the by no means unimportant economic and commercial theory of pricing and price-behaviour.
Like with all instruments in the marketing-mix, the use of “price” is limited by all kinds of factors and conditions. Within this frame, however, many companies have some latitude for choice, and the choice which will eventually be made will depend to a certain extent on the expected consumer reaction to a price and a range of prices. The amount of latitude the company has, depends very much on the nature of competition, the structure of wholesale and retail business, the long-term goals of the company, and so on.
Nowadays for the consumer-market in Holland, companies have lost an important degree of latitude in the field of pricing; for various reasons there has been an important “shift of power” in the direction of the retailers. Their latitude of freedom to set prices in anticipation of consumer reaction is limited because of the nature of competition which seems to favor an almost universal low pricing strategy. This in its turn severely curtails the use of other marketing instruments that depend on a sufficient margin of profits.
Limiting the study to consumer reactions to perceptions of prices, which subjects have market-researchers been studying? (2)
Important subjects have been:
- absolute and relative thresholds in pricing
- relations between perception of prices and quality
- general price-perception
- consumer reactions to price-variation.
These subjects have been studied with the following methods/techniques:
- experimental approaches (laboratory and field)
- panel data-analysis
- ad-hoc survey methods (either qualitatively or quantitatively)
- observational studies Ce.g. behaviour of consumers in shops).
Relatively early students have tried to study the reaction to the perception of prices by application of the psycho-physical methods borrowed from general psychology. As in psychophysics peoples’ reactions to quantities of various kinds (and especially to changes in quantities) have been closely studied, this approach seems to be a sensible one.
Panel Data Analysis seems the most sensible way to study consumers’ actual reactions to prices in the market. Such data has been extensively used to construct price-behaviour models in various fields. (3) (4)
The Ad-hoc survey has often been used to collect data about consumer perceptions of prices, or to try to get an insight into future reactions of consumers to certain proposed prices (prediction). Especially here the techniques that are applied are not very satisfactory and most marketers are bound to lack belief in the results obtained by them.
Very dependable information about consumer’s reactions to prices can of course be obtained by setting up marketing experiments in the field. Such experiments, however, are generally difficult to set up and are time and money consuming. Experiments with less strict controls, however, will often be set up by the big retail organisations and often quite satisfactory data on consumer’s reactions to pricing and pricing-levels can be extracted from them for practical application.
Some Important earlier studies and approaches.
Absolute threshold in price-perception
The study of thresholds in sensation belongs to the field of psychophysics. There are a number of ways to study such thresholds. Absolute limens define the upper and lower quantities in a stimulus (e.g. visual) for sensation to take place. As far as we know, Stoetzel (5) has been the first to apply the theory of absolute limens to the field of pricing. In general the absolute limens in the field of pricing are defined as the lowest price under which the consumer is starting to doubt the quality of a product, and the highest price which is yet acceptable to him (or above which he tends to consider the product as too expensive). Various technical approaches have been suggested by Adam, Fouilhé and Gabor and Granger. The techniques yield cumulative curves which by some researchers were characterised as log-normal. (6)(7)(8)
With NSS – PSM we have taken up this approach and incorporated the essential questions in the PSM. Our analysis, however, follows a different path.
Differential thresholds price-perception
A differential limen in psychophysics is associated with the minimum quantity of a stimulus which is necessary for the respondent to detect a change in perception. The theory about differential limens is associated with Weber/Fechners well-known general psychophysical law. (9) Some students have tried to establish the relevance of this law in the field of pricing (10) (11), but results have not been encouraging as Todd (2) remarks. The most which can be said is, that a particular variant of the law holds under certain conditions (Cooper).
The theory of reasonable prices
The theory of reasonable prices has been developed by Kamen & Toman. (12) According to these students consumers have set ideas about “a reasonable price” they are willing to pay for a product. One conclusion was that a price within “an acceptable range” would not be an important consideration with a consumer’s choice.
To a certain extent the theory behind NSS – PSM is based upon the hypothesis, that “reasonable” prices or ranges of such prices exist in many fields.
Relations between price-perceptions and quality
Various researchers have commented on the very important function prices have for the consumer as indicators of quality. According to Stapel (13) quality can never be separated from price and both components have to be studied in a relative set-up. Emery (14) mentions the following aspects:
- a judgement of a price is always a judgement which balances value against price
- every judgement of prices is relative (depends on knowledge of other prices and the value of the product for the consumer)
- a “normal” or “standard-price’ exist for every level of quality in every product-field; this normal price functions as an anchoring-point when prices are judged.
Many researchers commented on the finding that, given an untransparent quality of the product(a buying situation e.g. which lacks standards to judge quality), prices take over an important role as indicators of quality. The price-quality relation, however, is less important where the consumer feels able to judge quality in other ways.
Relevance of other approaches for NSS – PSM
The overview of approaches given above is necessarily very brief. We like to point out, that PSM is much connected with earlier work and theories.
- PSM can be compared to psychophysical approaches and techniques.
- Techniques to study “absolute” thresholds in price
- The theory of “reasonable prices” is highly relevant to our approach.
Hopefully, however, we advocate, that PSM overcomes some important drawbacks in earlier approaches. None of the techniques discussed seem to lead to very practical and valid results when applied in large scale ad-hoc consumer-surveys. We shall try to illustrate, that PSM may well hold promises as a practical and relevant technique to the marketing-researcher, as well to the theorist in the field.
NSS Price Sensitivity Measurement
The basic technique
Complete PSM consists of 4 basic questions which are answered by the respondent referring to a scale of prices.
- At which price on this scale are you beginning to experience …… {test-product) as cheap?
- At which price on this scale are you beginning to experience …… {test-product) as expensive?
- At which price on this scale you are beginning to experience …… {test-product) as too expensive – so that you would never consider buying it yourself?
- At which price on this scale you are beginning to experience …… {test-product) as too cheap – so that you say “at this price the quality cannot be good ?
Calculations and reporting are generally based on the sub-sample which answers the questions. Don’t knows are carefully registered – the level of “don’t know” being an indication of general price-consciousness – but the answers are not processed.
“Impossible answers” (e.g. a respondents judging a brand at a lower price as “too expensive” than merely as “expensive”) are corrected automatically when data is processed. The level of such “errors” generally amounts to a few percent.
Additional technical remarks
- Our research has shown that PSM is perfectly feasible for products and services, but also for individual brands.
- Applying the technique for a product, one should refer to “a brand of (product)” in a general way with the “too expensive-question” Otherwise, products with “inelastic demand” will yield unsatisfactory results. Applying the technique for an individual brand of a product, one should refer to the product in general with the “too cheap question” 4. A “too cheap” – brand question is generally irrelevant to large numbers of respondents.
- In general two versions of the price-scale are prepared, one from high to low and the other one from low to high. The first version is given with questions I and 41 the other version with 2 and 3.
- The range covered by the scale should be such, that impossibly low or high prices appear at the end of the scale- The number of steps and the intervals are determined by the nature of the market under consideration and general technical requirements. Most often we work with 25-40 steps.
- The technique can be applied to new products, the requirement being, that these can be concretely explained or shown to the respondents. Of course the level of “don’t know” will be higher in such cases.
- Questions 3 and 4 have been used by various researchers (Gabor & Granger and others). We have not found applications of questions I and 2 in the relevant literature, and also our way of analysing the results seems to be new. We don’t use buying-intention questions as a standard part of the technique.
Analysis & definitions
The four questions which have been presented will yield four cumulative distributions. We consider the “cheap” and “expensive” distribution in the first place.
Point of indifference and indifference- price
The cumulative distributions “cheap” and “expensive” are presented in such a way in a graph that they will cross each other. (15)
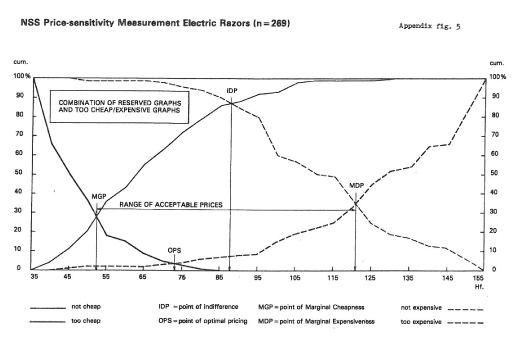
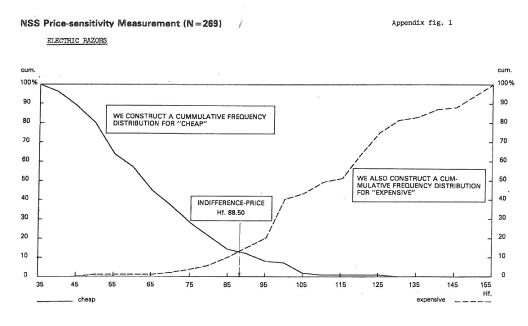 Figure I shows the distributions for price-sensitivity for electric razors in the Netherlands, The distributions cross at 14% which indicates a price of Dfl. 88.50 on the horizontal axis.
This means of course that at this price 14% of the respondents will experience electric razors as cheap and also 14% as expensive. This means also, that 72% experience this price as normal.
Definition of the indifference-price (IDP)
One, and only one price in the range, at which an equal number of People experience the product as cheap or as expensive.
Empirical analysis has shown us, that the indifference-price (IDP) represents a highly significant datum for a market.
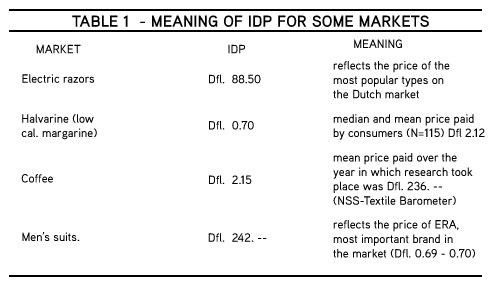
- The IDP generally represents either the median price actually paid by consumers of the product, or the price of the product of an important market-leader.
- We shall show that the IDP can vary for various sub-markets: eg people who are especially price-conscious, people who buy cheap or expensive brands etc.
- Experiments indicate, that IDP is based upon people’s experience with price-levels in the market, it has been shown that IDP will change when conditions on the market change.
- Interestingly one can show that IDP’s do vary for e.g. people who buy expensive or cheap brands but the differences are by no means as large as one would expect on a basis of an analysis of actual prices of products. Theoretically this will mean, that a rather general price-anchoring point in a market exists (“the normal price”) and that many people who buy more expensive brands or types are fully conscious of doing so.
A word of warning is in order: price-consciousness of this nature should never be equated with propensity to buy. One can be fully conscious that a product is “expensive” and yet prefer it over a cheaper alternative,
In table 1 we show the way IDP reflects “normal” prices for various markets.
Psychological threshold- prices
In almost every textbook of marketing one finds remarks about “psychological threshold-prices”. In pricing a car at Dfl. 9,990.– the marketer makes use of such ideas.
PSM yields significant and immediate information about the importance of various thresholds in price-consciousness. Consider graph 1
Variations in the indifference-percentage
The indifference-percentage can be very low (e.g. 5 – 15%) but also quite high (e.g. 30%). In general low values will indicate a “sharp” price-consciousness where as high values generally indicate diffuse price-consciousness.
When testing new products one generally finds higher values for the indifference percentage. Now let’s consider our two remaining distributions (“too cheap” and “too expensive”).
The optimal pricing point
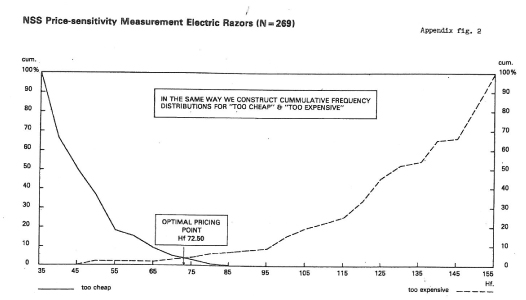
The two distributions “too cheap” and “too expensive” can be represented in exactly the same way and the other ones.
One can again discern a point at which the distribution cross: we have called this point the optimal pricing point.
Definition of the optimal pricing point
At the optimal pricing point an equal number of people believe a product is too cheap or too expensive.
The price associated with this point represents a price at which resistance against the price of a particular product (too expensive or too cheap) is very low while the percentages iron each other out.
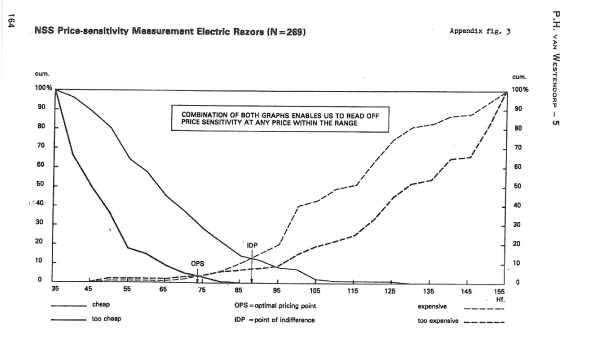
Let’s look at the electric razors: the optimal pricing point is reached at Dfl. 72.50 and lies considerably under IDP (Dfl. 88.50). At OPP only 4% experiences the product as too cheap or too expensive, whereas at IDP already 8% experiences
Range of Optimal Prices
Although the two distributions almost always cross, there is no particular reason why they should. In fact we had a few cases where they did not. Thus with coffee “too cheap” ended at Dfl. 2.10 and “too expensive” started at Dfl. 2.20 (250 grs.). In that case we speak of the optimal price-range instead of the optimal pricing point.
Thresholds in the distributions
As with the earlier distribution one can also find thresholds in the “too – too” distributions. They are generally found more often in the “too expensive” distribution than in the “too cheap” distribution.
In the distributions for electric razors we find some points at which resistance abruptly increases (Dfl. 5O.–,Dfl. 1OO.–, Dfl. 150.–). This indicates a different kind of threshold.
Combination of the four distributions
The four distributions can be combined in one graph.
Full price-consciousness at each price-level can now be read off quite easily and be referred to either OPP or IDP.
Relations between IDP and OPP
Cases where the indifference-price and the optimal-price are the same are most numerous. In a number of cases in our experience OPP is to be found at the left of IDP, whereas we have not yet seen cases where the reverse is true. Separate positions indicate some kind of “stress” in price-consciousness: the consumers experience a “normal price” but a number of them experiences this price as too high already. One could expect this state of affairs to happen in a market where recent sharp price-increases took place and have been experienced by the consumer. In most cases, however, the distance between IDP and OPP seems to be small.
Marginal Pricing Points
Comparison between the two sets of distributions can yield useful information about limitations in the acceptable price-range for important numbers of consumers.
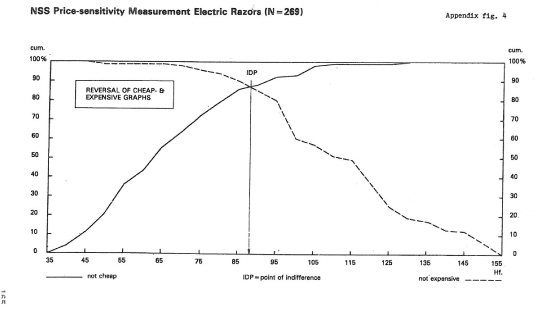
The graphs in the first set of distributions can be reversed, yielding the “not-expensive” and “not-cheap” distributions.
Combining the reversed graphs with the original “too – too” distributions will yield two new crossings. We called these points the points of marginal cheapness and marginal expensiveness.
At the point of marginal cheapness a price is given, where the number of people which experiences a product as “too cheap” is larger than the number which experiences it merely as cheap. Mutatis mutandis the same thing happens at the point of marginal expensiveness: the number of people experiencing the product as “too expensive” is larger than the number of those experiencing the product merely as expensive.
The range of prices between those two points has been called “the range of acceptable prices”. From our experience with PSM we have always noted, that the share of sales below or above these points is very small. A major part of business is always transacted within the range of acceptable prices.
Complete PSM yields the basic information, given in the table below.
The table below shows how price-consciousness of electric razors might be presented.
The word “optimal” signifies that at OPP least resistance against the price can be expected from the consumers. No relation to the “optimum-theory” in economy is meant.
These results can of course be graphically presented for all prices within the range. In the resulting graph one can determine the relevant markets (“normal”, “acceptably cheap”, “acceptably expensive”) at a glance.
APPLICATIONS OF THE PSM-TECHNIQUE
Fields of a application
PSM has already been applied by NSS in quite a number of studies. At this moment there is satisfactory experience with fast moving consumer goods (coffee, margarine, beer, detergents, toilet tissue etc.), with services`(newspaper-subscription, hairdressers’ tariffs etc.) and with durables (electrical razors, sewing machines, men’s suits etc.).
The technique has been applied to existing as well as to new products.
Only in some cases the application of the technique presents problems: where a quantity of a product cannot very well be defined (like e.g. with hair-spray where numerous sizes of can exist).
The technique can be applied to products but also to brands, provided one adapts the basic questions as has been described earlier.
Our experience indicates that application of the technique is not necessarily limited to the field of pricing. NSS has applied the technique to incomes.
Interestingly in this case OPP lies to the right of IDP. OPP reflects exactly the premium-income for a number of insurances. In theory the technique could also be applied to other problems with which the experience of quantity plays a role: e.g. the number of chocolates in a box, speeds on motorways, or the number of pages of women’s magazines.
We shall now discuss a number of concrete applications.
A. Price-psychological description of a market
In combination with panel-data on demand at various prices and information about prices of brands on the market PSM yields a very useful picture of the price-psychological situation on a market.
One can determine for instance, whether much demands exists at prices to the right of the IDP. The results can also be used to determine the right “psychological” range of prices for a series of types of a product.
B. Pricing new brands or products
In a number of cases PSM has been used to determine consumer’s experience of prices of new products. One can e.g. determine, whether the IDP for people with differing attitudes towards a new product differs.
An IDP for a positive group much to the right of the IDP for a less enthousiastic group can indicate a higher value of the product for the latter group (see also E, value analysis).
C. Threshold prices
We have seen in the example (electric razors) that threshold-prices can be easily determined with PSM. Threshold prices are very common, especially in the field of the “expensive” and “too expensive” experience.
D. Price-psychological segmentation
Marketing-researchers have a number of techniques at their disposition to segment markets in a psychological way. Attitude-scales on price-consciousness or “deal-proneness” exist and have been used extensively. PSM now provides a way to quantify the results of these kinds of studies in a meaningful way.
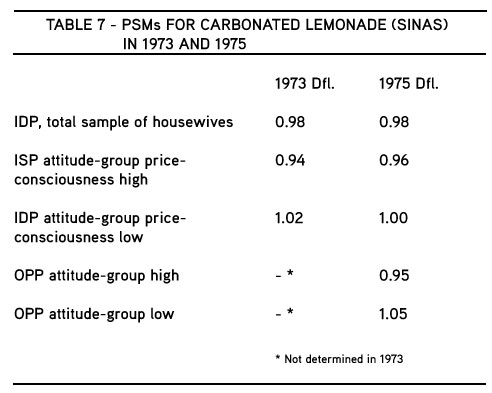
This table illustrates two things:
- A clear difference between the high- and low-price-consciousness groups, especially in 1973.
- Notwithstanding inflation IDP’s in 1973 and 1975 are the same. This reflects exactly the sad state of affairs on this Dutch market where extreme competition exists. The fact that the difference (in money) between the two attitude-groups has been halved might well be connected with the nature of a market where the situation for the products grew progressively worse over recent years. IDP in fact should be Dfl. 1.27 to keep up with the times!
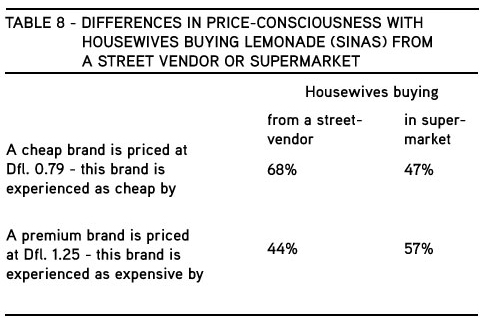
Table 8 illustrates the differences in price-consciousness which exist with housewives using various outlets.
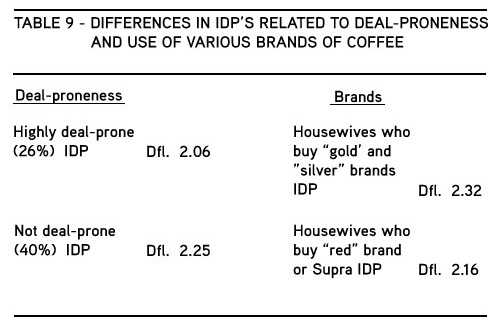
Another example will illustrate the difference between housewives with various degrees of “deal-proneness” and with housewives who buy different brands (coffee-market).
These examples will have shown sufficiently, that the technique can be applied with problems of price-psychological market-segmentation.
E. Value Analysis
Sometimes the market-researcher wants an insight into the value attributed by people to products etc. PSM can certainly help to gain an insight into such values as can be shown by the following example.
Two books, an encyclopedic handbook and an atlas a) are sold at a price of Dfl. 1OO.-G (tied offer). The publisher wants to know which is the value of each of the books in the combination for the consumer.
PSM was applied on a sample of buyers for bath products separately (imaginary situation). The results where the following.
 The meaning of this test was highlighted by the results of quite a different question in the same survey. When asked to divide 10 points among handbook and atlas, the mean score for handbook was 6.3 and for atlas 3.7!
In this way the publisher can actually determine the value of the premium he offers with his tied offer (Dfl. 21.–).
F. Tracing the dynamics of pricing
Repeated application of PSM over a number of years will provide a useful insight into the development of the price-psychological situation.
In a period of inflation it can be very important for a producer to detect at an early stage, when “lags” are going to appear between psychological prices and objective market-prices.
Consider the case presented under D. Obviously the psychological price (indicated by IDP) did not move at all within three years. Actually, to reflect costs of living the psychological price should have been Dfl. 1.27 for 1975. Some producers of premium-priced brands tried to keep up with the times and noticed that their market-shares were adversely afflicted. Obviously IDP in this case is very much determined by the pricing-level of the private-labels which were selling mostly under Dfl. 1.– in 1975.
G. Setting prices for special offer etc.
From the PSM-graphs one can get useful information about the price-reductions one has to offer to make a “psychological impression” on the consumers. In one case e.g. we discovered that a reduction of 40 cts. on a basic price of Dfl. 3.98 could not possibly make much of an impression on consumers – the price of Dfl. 3.98 was far to the right of even the point of marginal expensiveness and the tracts for the expensive – and too expensive graphs were quite flat between Dfl. 3.98 and Dfl. 3.58, indicating no change in price-consciousness. A reduction, however, of 50 cts. would have made a world of difference because of the very important (29%) threshold present with both curves.
PSM – FUTURE DEVELOPMENTS
At this moment work-on PSM is still in progress. Although we are satisfied that we did develop a quite practical instrument of research which yields useful information for the solution of a wide range of marketing-problems it is certainly true, that much needs yet to be done.
At this moment various projects are in progress and we shall be able to provide more information on PSM at the ESOMAR conference in Venice.
Some directions of research are briefly described below. We are very grateful to Prof.Dr. A. van der Ewan and his collaborators (Erasmus University Rotterdam)who have undertaken to study PSM from an economic point of view.
Psychological and behavioural research in pricing
In a critical article about PSM in the Dutch advertising press Helden (16) remarks that two traditions in pricing-research exist: the behavioural one and the psychological or perceptual one. Clearly PSM is an example of the perceptual approach (like the well known Gabor & Granger techniques) and Holden certainly is right when he deplores the lack of integration between the two approaches.
At this moment a project is under way which will enable us to test extensive PSM-data against a pricing-model of one of our clients based exclusively on behavioral data. We hope to comment on some of the results in Venice.
We are convinced that much more needs to be done in this field.
International application of PSM
At this moment PSM is experimentally used by a number of members of the INRA-group of companies. Results up to now indicate, that the technique can be applied without difficulties in European countries. At this moment we have at our disposition research-data collected by OBSERVA for coffee in Denmark. Comparing the results with the Dutch results one is struck by the amount of similarity between the two sets of results. One notices e.g. that “the range of acceptable prices” is exactly the same in both countries (correcting for the differences in general price-level) but that a slight difference exists between the positions of IDP s within the ranges.
Theoretical Developments
At this moment there is certainly not yet a well developed theory behind PSM. Some important questions are:
- Why does PSM performs the way it does? In which ways is PSM related to theories about consumer price-behaviour? Which are the theoretical (psychological, economical) meanings of the defining characteristics like IDP, OPP and the marginal points.
- Can data from PSM be generalised for different fields of application? Can theoretical distributions be fitted against the cumulative PSM distributions?
V. der Ewan has remarked, that it might well pay to study the distributions of individual differences (or the individual ranges between answers of single respondents). This is certainly an obvious step to take.
Our point of view, which we share with Ehrenter (17) is, that an empirical approach to further development seems the most promising one. This means that in the first place much material has to be collected, showing the performance of PSM in different fields of application and under different conditions.
Secondly proof is needed, that PSM perceptual data has also a behavioural meaning. Proof of this nature would of course strengthen the importance of the technique immensely and also will lead to a much more relevant theoretical development.
Technical Developments
We are by no means certain that at this moment the best ways of putting the PSM-questions to the consumers have been developed. Experiments with various alternative ways of questioning might well lead to improvements, reducing for instance the don’t know level (which, however, is not alarmingly high).
Also some work needs yet to be done on the development of statistical tests to determine statistical margins for IDP etc. Development of statistical tests will of course enable us to determine sample-sizes in a more rational way.
PSM is now fully programmed for the NSS IBM S3 computer with markreader. The computer “cleans” the data (corrects logical impossibilities), it produces the basic cumulative distributions and also the necessary graphs.
Clients’ reactions to PSM
NSS did eight development-studies on PSM before putting the new research-technique on the Dutch market. Most of these studies were extensively discussed with experts in the various product-fields.
At the moment a number of PSM-studies for clients have been finished and more are under way. In general conversations with clients and others do indicate, that PSM-results are well in keeping with empirical insights developed by experts in various fields. While this by no means can be considered as “proof” of the validity of the
Peter H. Van Westendorp – Nederlandese Stichting Voor Statistiek
References
- Worcester, R.M. (ed), Consumer Market Research Handbook, McGraw Hill, London, 1972.
- Todd, P.P., Marketing research and pricing problems, NSS information on PSM, 1975 (in Dutch).
- Koning, C.C.J. de, Prijsgedragsmodellen, Handboek voor commerci le beleidsvraagstukken, Kluwer, Deventer, 1971.
- Heteren, A.H.J. van, De verbroken verticale prijsbinding, bet merkartikel en de horizontale prijsdwang, Economisch Statistische Berichten, 15.10.1975.
- Stoetzel, J., Psychological/sociological aspects of price, in; Taylor B. & Wills G. (eds), Pricing Strategy, Princeton N.J., Brandon Systems Press, 1970.
- Adam, D. Les r actions du consommateur devant le prix, Sedes, Paris, 1958.
- Fouilh , P., The subjective evaluation of price: methodological aspects, in Taylor & Wills (see ref. 5).
- Gabor, A. & Granger, C. , The pricing of new products, Scientific business, 3, Aug. 1965.
- Woodworth, R.S. & Schlosberg, H., Experimental Psychology, Menthuen London, 3rd ed., 1954, p. 193 ff.
- Cooper, P., Subjective economics: factors in a psychology of spending, in: Taylor & Wills (see ref. 5).
- Cooper, P., The begrudging index and the subjective value of money, in: Taylor & Wills (see ref.5).
- Kamen, J. & Toman, R., Psychophysics of prices, Journal of Marketing Research, 7, february 1970.
- Stapel, J., Fair or psychological pricing?, Journal of Marketing Research, 9, february 1972.
- Emery, F., Some psychological aspects of price, in: Taylor & Wills (see ref. 5).
- Guildford, J.P., Psychometric theory, McGraw Hill, New York, 1954. The idea to cross ascending and descending cumulative distributions stems from psychometry. Our IDP is known in psychometry as “point of equal value”.
- Prijsgevoeligheidsmeter – NSS ontwerpt een nieuw test- instrument, Adformatie, 4-3-1976.
- Ehrenberg, A.S.C., Data reduction, Wiley, London, 1975.

