Jon Puleston and Mitch Eggers
Researchers have a lot to think about when conducting multi-country studies. Over the past few years, as clients have increasingly taken advantage of global panels to conduct research across international markets, there has been no shortage of studies on the many factors that influence the accuracy of data gathered internationally.
However to date, there has been little guidance on which factors are the most important, or which data quality improvement techniques have the biggest impact.
Is it more important to focus on the quality of the survey design or the quality of the panel? What aspects of panel quality matter? Should researchers worry more about speeders, untruthfulness or authenticating identity? When balancing on demographics, is age or gender more important? Should researchers focus on question design to make research more engaging, or on the psychology of respondents and their willingness to answer truthfully? How do all these factors vary by country and survey topic?
If that list has you biting your fingernails, hold on.
Our recent paper Dimensions of online survey data quality: what really matters? discusses the results of two large-scale, multi-country survey experiments interviewing more than 11,000 respondents in 15 countries that tested each of the factors in a treatment versus control group approach.
What we found was that they’re all important.
The main finding from the research is that speeding, lying and panel sourcing all impact data quality at levels approximately equal to demographic balance and question design techniques. But that’s not the whole story. Their impact varies greatly depending on the nature and design of the question, the incidence of the behaviour being tested, the age, sex and nationality of the respondent and more.
Vive la Difference
It’s been said that we’re all more alike than we are different. While we’d all do well to keep that in mind, it’s also true that there are fundamental cultural character differences among people from different countries. And those differences cause people to answer surveys differently, resulting in significant data variances in multi-country studies.
The one factor that underlies all others is basic cross-cultural variance. Our experiments showed an average shift in results of 7.1 per cent across all 15 countries. However, data shift from individual countries on a question-to-question level was significantly higher, with result changes of up to 15 per cent not uncommon. The traits that we observed which had the greater impact on variance included:
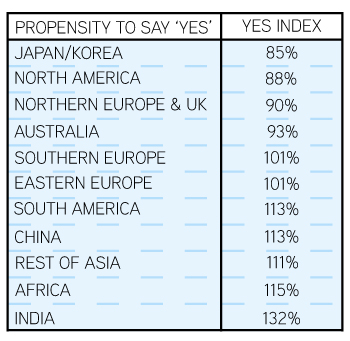
Yes: The propensity to answer ‘yes’ to a simple yes-no question varies by country. Based on aggregated data from 60 yes-no questions asked in 30 countries, Western and more developed markets in Asia trended less likely to answer ‘yes’ to a question. Respondents in India and Africa tended to answer ‘yes’ the most, while Southern and Eastern Europe were in the middle.
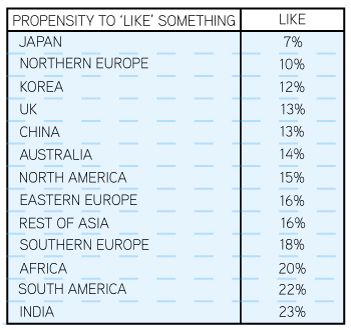
 Like: Participants’ propensity to report liking something more than tripled from Japan (7%) to India (23%) based on the aggregated self-reported liking scores from 90 different questions. Northern Europe and Korea were at the low end of the scale, while South America and Africa were at the high end. While the Japanese and Koreans, Northern Europeans and British all say ‘yes’ to a similar degree, ‘liking’ draws out more measurable differences.
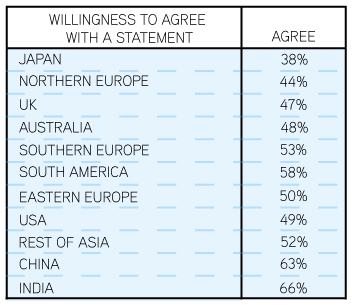
Agree: On aggregated agreement scores from 580 questions asked in various surveys across 30 countries, agreement patterns are different from liking and propensity to say ‘yes’. For example, the Chinese are very likely to say they agree with something, but relatively less likely to say they like something. Once again, Japan and Northern Europeans are the least likely to agree with anything.
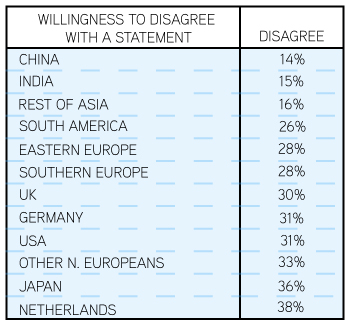
Disagree: When expressing disagreement, a division arises among Northern Europeans that does not exist with positive scoring indicators. The Dutch are much more willing to disagree than others and measurably outscore other Northern European countries. At the other end of the scale are the Chinese, who are reluctant to disagree.
On the fence: Across many countries in Asia (excluding India and China) there is a strong reticence to express opinions, which results in a tendency to give neutral scores. Closely behind Asians are Northern Europeans, who also have a high neutral score.
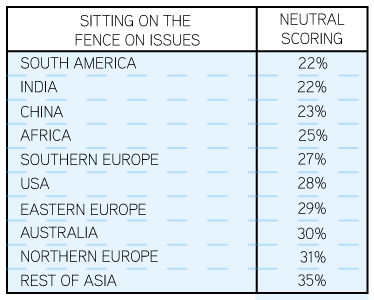
When using likert range scales, cultural differences result in massive skews in the relative score attained across different countries. At the one end of the scale, the Japanese very rarely present a positive opinion and at the other end, the Indians very rarely do not. Spain, Russia and South Korea are right in the middle, with the UK and USA on the negative end and Mexico and China on the positive.
The importance of weighting
With knowledge of these differences in the basic character of respondents across countries it is possible to re-weight certain types of questions to deliver more comparable cross-country data. For example, one of the test questions in our experiments asked respondents to rate their happiness. The raw data showed Mexicans rated themselves happiest, while the Swedish and German respondents rated themselves the least happy. However, when the data was weighted to account for question agreement bias, the data showed personal happiness rating similar in most countries with the exception of China, India and Brazil, whose respondents rated themselves less happy.
Translation and interpretation
Because this factor is fundamental to every question on every survey across countries, we do not have statistical evidence of variance from translation and interpretation. It is nonetheless critically important and can lead to data variance scores on certain types of questions which make other variances pale in comparison.
Our research showed word selection lists were most vulnerable to language and interpretation. Word selection rates even between two countries that speak the same language can differ based on how the words are used in each country. This is particularly important for range choices, where subtle meaning can make a difference in data. Our recommendation is to use proven, professional, and detail-oriented translation resources and the time to understand how words can be interpreted across languages.
Pants on fire: testing untruthfulness
In multi-country studies, untruthfulness presents the largest potential corrupting influence to accurately measure any form of low incidence personal behaviour, second only to basic cross-cultural response bias.
But what is the impact of untruthfulness on survey data quality, and how can we deal with this issue to accurately compare data across countries?
First, we needed to define ‘untruthful’. We based our definition on a technique developed in conjunction with GMI’s director of modelling Eli Drake to measure authenticity of responses from each respondent. Briefly, an untruthful respondent is one who answers ‘yes’ to a high number of improbable questions, which we calibrate using known sample and population benchmarks. Our research found that truthfulness varies greatly by country and is directly related to culture. In cultures with high levels of corruption, as measured by the World Bank’s corruption index, higher percentages of online respondents fail our honesty detector.
We are exploring other factors that influence untruthfulness, such as incentive to lie from anticipation of rewards for qualification and completion, respondents’ views of market research, and whether participants care if their voices are heard. Research to date indicates lying varies between three and 30 per cent from country-to-country and is a major risk factor to accurate data.
Some question types suffer more impact
Untruthfulness impacts some questions much more than others. It is most prominent when asking about a high status activity like owning iPads, visiting Harrods or reading Vogue magazine. In our experiment, we measured upwards of 100 per cent overclaim among the untruthful for these types of questions compared to the totally truthful group.
It has less dramatic, but nevertheless significant general influence on any question surrounding personal behaviour (e.g., have you washed your hair today), but is a fairly benign issue when recording attitudes toward issues. The question least influenced by removing those who over-report, interestingly, was where respondents had to bet some imaginary money on their choices.
How to mitigate untruthfulness
Because a significant proportion of the population will honestly answer ‘yes’ to one, two or three of our low incidence questions, removing all of these respondents from the sample would actually introduce bias and remove honest survey takers. Our suggestion is to consider screening out respondents who answer ‘yes’ to four or more low incidence questions and flag any respondent in the data who answers ‘yes’ to more than three. Moreover, we would take note of any differences in how this group answers sensitive questions that may be effected by untruthful respondents.
Getting nowhere fast – the impact of speeders in multi-country studies
Almost everybody speeds. Regardless of the country we are fielding the survey in, speeding issues are probably the biggest general problem we face when conducting online research. In fact our research showed that 85 percent of the respondents sped through at least one question.
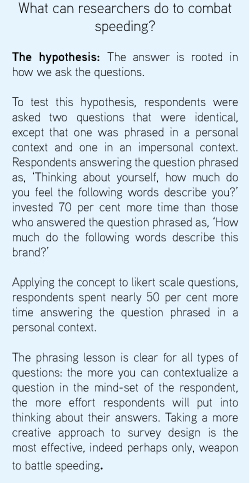 We found, as we expected, that speeding variance did increase as respondents progressed through the survey. It averaged four per cent on the first few questions and rose to around eight per cent at the end, which ranked this factor as the highest source of overall variance. We also found that it is the younger age groups and men who tend to answer survey questions faster.
National differences in speeding
At first glance, it appeared that some nationalities speed through surveys a lot more than others. But when relative reading and comprehension times in different countries are taken into account as part of the significant differences in average completion time, it becomes clear that thinking times are remarkably similar country to country.
Across all countries, we saw a rapid decay in thinking time given to questions presented in repetition. The first time the question was asked, it received seven seconds of thought on average. The second time, it got five, and for the third and subsequent instances, the question got an average of two seconds. For simple yes-no questions like ‘are you aware of this brand’, thinking time averaged about one second, but if presented in a multi-choice list, thinking time dropped to less than one second.
Comparing answers from the slowest and fastest halves of the sample, it was evident that there were significant differences in answers for binary (30% variance) and multiple choice (40 % variance) questions. On likert scale questions, speeding tended to bias data toward the positive, and was more pronounced in questions where there was natural disagreement. The root cause of speed-related data variance is declining thinking time.
Our experiments have shown that speeding has significant impact on data across all countries, and that, because everybody speeds, simply removing all speeders from the sample is not an option.
Jon Puleston is Vice-President Innovation at GMI and Mitch Eggers is Chief Scientist at GMI


1 comment
Interesting research and best practice advice. You touch on language but a study from last year went into further depth showing the results variance between respondents completing studies in their native tongue vs a second language irrespective of their ability within it. See here – http://viewer.zmags.com/publication/59ff0ae2#/59ff0ae2/56 – for more details.