Randy Brooks
Over the past 40 years an increasing percentage of the work done in survey research has required the inclusion of samples drawn across broader and broader geographies. The challenge of doing well thought out research is amplified when consumers from across the globe are to be included in the project. Logistical issues compound, timing is elongated and a significant level of potential misunderstanding is created when translating the questionnaire and communicating with other cultures and languages.
Thankfully the logistical difficulties have for the most part been solved. One particularly intractable problem however is that consumers in different countries use scales, even those that are perfectly translated, differently. The most common scale – Excellent, Very Good, Good, Fair and Poor seems simple enough but in some cultures the consumers are relatively “easy graders” while others use the scale quite differently. A researcher who wishes to answer even quite simple questions (“How are we doing in Europe versus Latin America”) can be stymied by this problem.
Directions Research in conjunction with Toluna conducted a world-wide survey among over 12,000 consumers to illustrate the problem and to provide a recommended solution. The data was collected in the G-8 plus BRIC countries. The questionnaire was translated into the appropriate language for each country. Respondents completed the survey on-line.
The survey covered three categories (soft drinks, personal computers and cell phones). Users of each category completed a short usage and attitude questionnaire that explored their category/brand usage and usage frequency. They were also asked their opinions about 5 brands in each category that they had used or were familiar with. The attitudinal battery was simple:
- Overall Satisfaction
- Product Quality
- Lowest Price
- Available where I shop for this category
- A well-known brand
A thorough analysis was performed and the results we will report here are illustrative of the findings in all categories. For simplicity we will detail the results observed in the soft drink category for Coca-Cola Classic on Overall Satisfaction.
Penetration Share – Coca Cola Classic
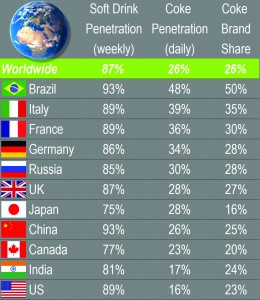
Nearly 9 out of 10 respondents reported using soft drinks and 1/4 of them reported drinking a Coca-Cola Classic yesterday – nearly a BILLION people worldwide thus drink at least one Coca-Cola Classic daily!
Coca-Cola Classic has an estimated 26% brand share worldwide with particularly strong performance in Brazil and a less powerful position in Japan.
These data points are simple and clear in each country. The world-wide estimates are a straight forward matter of weighting country results by population. The questions are not subject to much difficulty in translation and the responses in every culture mean the same thing:
- Which of the following products have you used in the past week?
- Which of the following brands of soft drinks, if any, did you drink yesterday?
- How many (insert each brand used) have you consumed in the past week?
This simplicity supports direct cross country comparisons and aggregation can be made around the globe or by region.
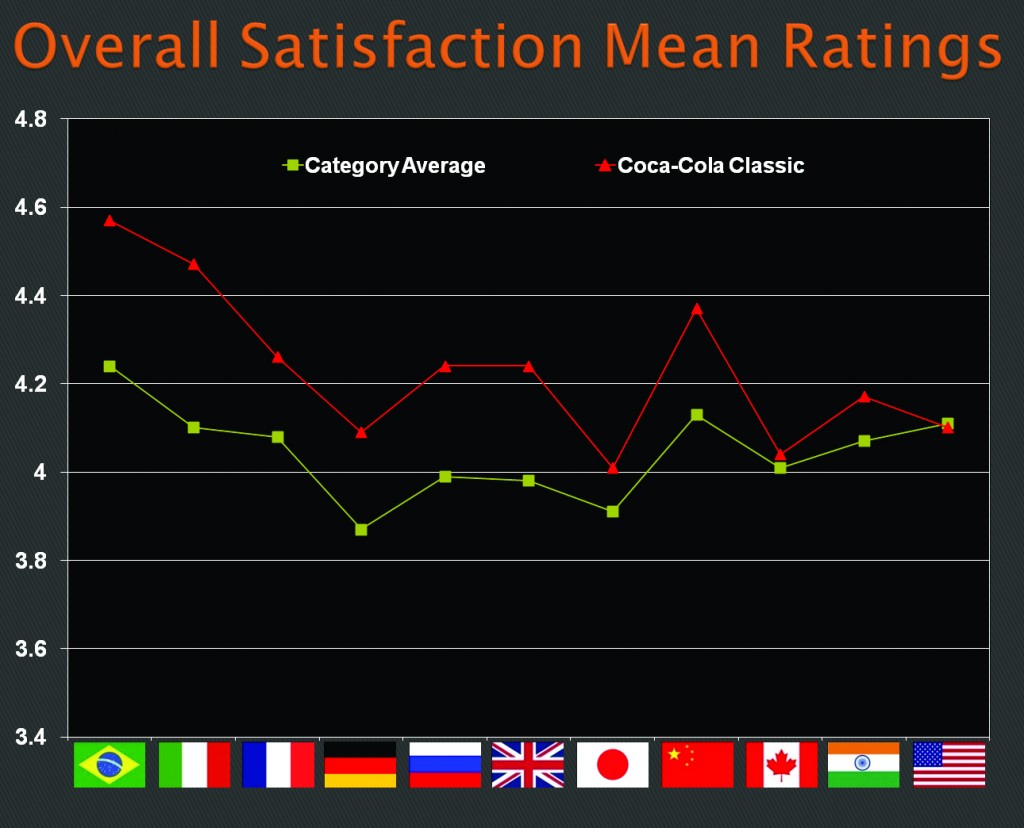
As almost all experienced international researchers know ratings questions do not result in simple and easily contrasted responses by country. The chart below shows the overall mean ratings satisfaction scores for:
- Coca-Cola Classic
- All soft drinks respondents rated in each country (category average)
The variation in the category average score by country illustrates the cultural bias observed in ratings data that creates problems. In Brazil a score of 4.2 is merely average, while that same score would be outstanding in Germany or Japan. Aggregation of such scores across countries is not useful, at best, and misleading in most cases. The bottom line is that consumers in Japan and Germany are “tougher” graders than consumers in Brazil or Italy.
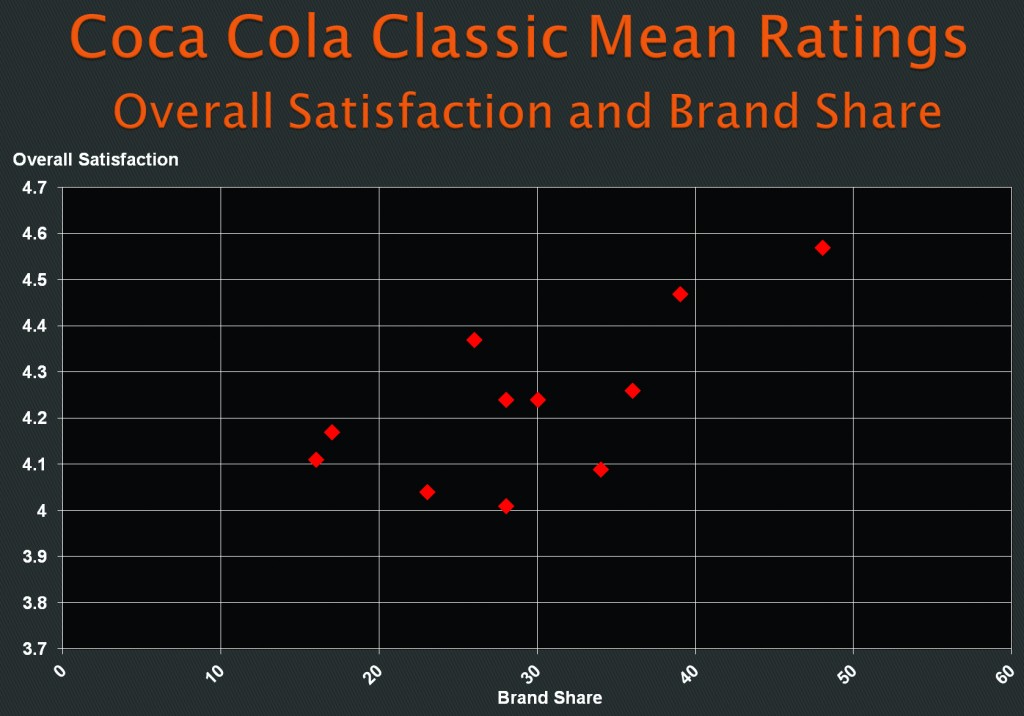
An examination of the correlation of the mean rating on “overall satisfaction” and brand share demonstrates a minimal relationship between these two key metrics.
Brand Ranking – A New Alternative
In our study consumers also rank the same brands. We showed the logos of the brands they used and asked (for each attribute)
- Please think about your overall satisfaction with the soft drinks you use. Which is best? (Record Response)
- Of the remaining 4 brands now which is best for overall satisfaction?
- Repeat until the 5 brands have been ranked.
This approach eliminated the “tough grader” aspect of ratings. No matter who you ask or where they live the rankings will provide directly comparable metrics. Ask this question in French, Italian or Japanese and the result is a clear and directly comparable metric country to country, respondent to respondent.
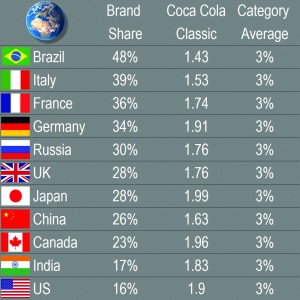
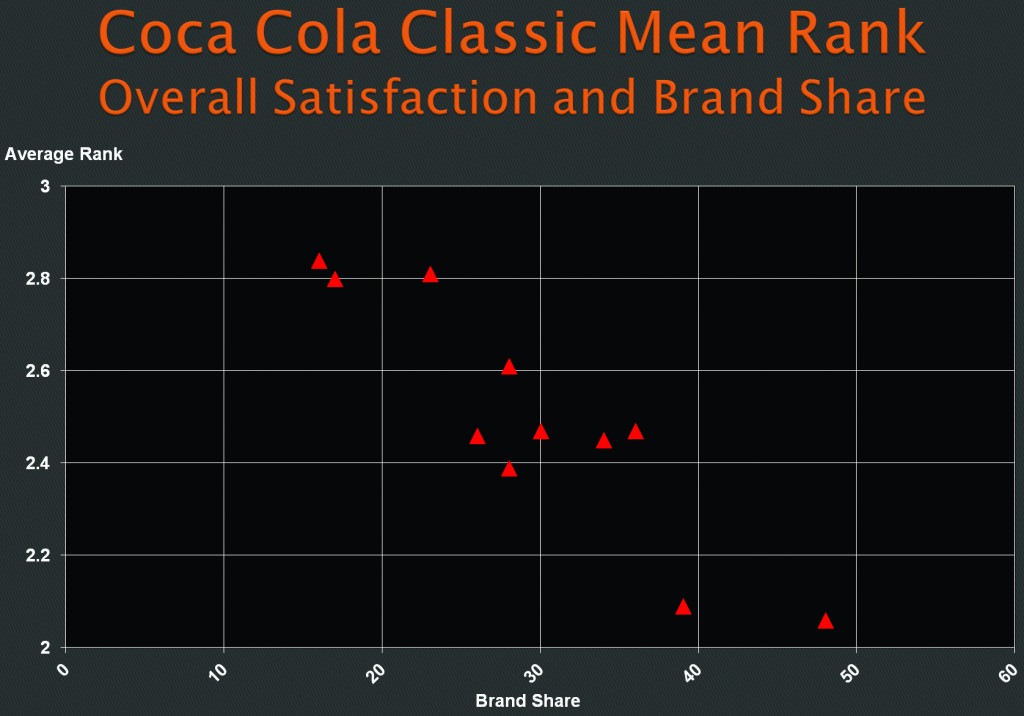
This approach yielded an average rank for Coca Cola Classic in each country that can be contrasted with brand shares as shown on the table below. Note that when consumers rank 5 brands in each country the category average score is, by definition, 3.00. There is no cultural bias in rankings. Note also that better (lower average rank = better) scores on overall satisfaction are found in countries where Coca Cola Classic enjoys superior brand shares.
The strong relationship between good scores on the rankings question and brand shares is illustrated below.
Are Rankings Better?
Extensive research in the United States has been conducted to examine the validity and sensitivity of rankings. This work included 8 projects across a variety of product categories including quick service restaurants, beer salty snacks, credit cards, soft drinks, computers and cell phones.
The focus of the analysis of the work in the United States was on validity and sensitivity.
- Validity – the correlations of brand rankings with brand shares are consistently better than brand ratings scores. Average rank scores on attributes are 20 – 40% more highly correlated with brand shares than ratings are.
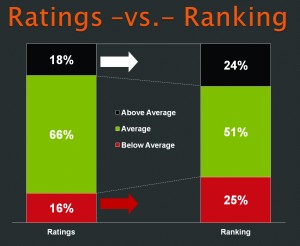
- Sensitivity – in every category for every attribute an overall average score was calculated. Then each brand was tested against the category average at a 90% confidence level. The chart below summarises the results of this testing.
Why are rankings superior to ratings?
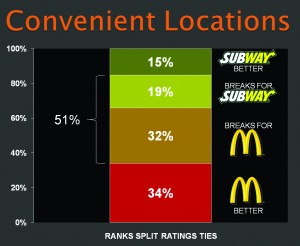
Ratings questions permit respondents to indicate that brands are “tied”. Our work has shown that in variety seeking categories as many as 30 – 40% of the respondents who evaluate a pair of brands will rate them equally on any given attribute. This is illustrated on the final charts. About 50% of respondents rated McDonald’s and Subway as “equal” on convenient locations.
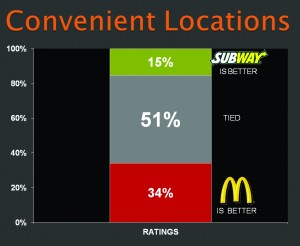
When the same respondents ranked brand these apparent ties were broken and McDonald’s was judged better by 3/5ths of the respondents who rated them as equal to Subway. Clearly, McDonald’s advantage over Subway on Convenient Locations is much larger than the ratings data would suggest.
In many categories, the use of rankings data “spreads” the brands out more. The elimination of apparent ties adds sensitivity to the image data and allows the researcher to see the difference between brands more clearly. The enhanced correlation with behavior supports the assertion that these differences that result from breaking the ties are important to understand.
Conclusion
International Researchers have struggled for years to report sensible brand image scores to management. All ratings scales suffer from cultural bias that makes the reporting of attitudinal data challenging. The adoption of brand rankings can eliminate cultural bias. Brand rankings have also proven to be more predictive of brand usage and to be more statistically sensitive.
Randy Brooks is founder and president at Directions Research

