Aakriti Verma and Sreenath Raghunath
Quantitative key driver analysis from spontaneous survey responses.
Positive customer experience is one of the most important driving factors of success for any business. For this purpose, organisations employ different methods to capture customer opinion, understand customer experience and identify the key driving factors. The key driver analysis helps to answer questions such as:
- What drives my customer to choose an alternative brand?
- What influences a consumer’s propensity to purchase my product?
- Which consumer group is most satisfied with our services?
This article is centered on a sample study which explores statistical analysis of loyalty drivers derived from qualitative data.
The data for the key driver analysis can be collected either qualitatively (from spontaneous open ended responses) or quantitatively (from scaled responses). Open ended responses are the top-of-the-mind responses which help to bring out the immediate issues faced by the target group. The surveys that gather this type of data ask the respondent to give an overall rating for the product on a scale first and then to list down the reasons for that rating. Scaled responses on the other hand are captured by asking the respondents to rate the overall product followed by rating the attributes on a scale, based on their experience. The attributes are listed down before the survey is actually launched amongst the target group.
Both the methods have their own unique characteristics. The opinions from the open ends leave room for improving the scope of the study because we may identify new drivers and make the driver list/attribute list more effective. On the other hand, scaled responses lack this flexibility since the list of drivers is more or less fixed and the respondents are only rating these pre-determined attributes. Moreover, in case of studies involving a lot of drivers, scaling becomes unfeasible and prolongs the length of the survey.
Scaled responses can be useful when we are quite clear about the different drivers and when we have to measure the performance of a driver vis-a-vis the others. The open ends helps in capturing the true opinion of customers but they do not provide a direct comparison between the attributes.
This sample study illustrates an approach on how open ends can also be statistically analysed since statistical testing enables us to identify true driving forces as they rule out occurrence of any random event.
The Sample Study
Suppose we launch a survey to understand the drivers of loyalty score for a consumer durable company. The study is aimed to nail down the high level root causes responsible for both loyalty towards the brand and prepare the action plan for improving customer relationships. A structured questionnaire is adopted to capture the feedback. The main highlights of the questionnaire include:
- The willingness to recommend the Company products on a scale of 0-10 where a score of 0 means extremely unlikely and a score of 10 means extremely likely.
- A mandatory open ended response, asking respondents who give a top 2 box rating for the reasons to recommend and the others about what would make them more likely to recommend their brand.
The open ended verbatim that we collected from the survey were unstructured and not analysable as it is. They have to be quantified by going through the responses captured during the survey, understanding it and assigning a code for them.
Assignment of codes to the verbatim ensured that all the key points mentioned in the verbatim were captured. Before the open ended verbatim were coded, an exhaustive list of drivers was identified, grouped under themes and assigned codes. Grouping can be done either manually based on experience or by statistical techniques like factor analysis. Usually manual coding is augmented with automated coding mainly to ensure that all the responses are captured. Both the methods have their own pros and cons and are used depending on the requirements. The process flow of coding can be summarised as:
- Read the open ended responses
- Identify the drivers at a granular level based on judgment and business experience
- Aggregate similar drivers and form larger groups or use statistical techniques of factor analysis
- Shortlist the drivers with most mentions/importance in respect of the study
- Group these drivers under various themes
- Assign codes to the drivers according to the themes
For example, the open ended response given by a respondent who gave a score of 10-
“The company is quick to adapt to new technology and products are reliable. They have a wide variety among products.”
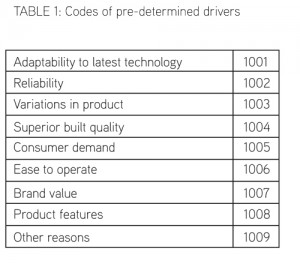
The open ended responses like these can be coded from a set of drivers identified by method mentioned above. An example of such a code list is illustrated in the table below:
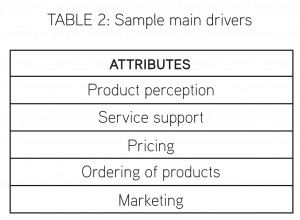
Considering this list, we coded “The company is quick to adapt to new technology.” as “1001”, ” products are reliable.” as “1002” and “They have a wide variety among products” as “1003”. In a similar way all the other open ended spontaneous responses can be coded manually. Similar drivers are clubbed together under a larger group/theme according to the value chain of a consumer durable company. An example of such main themes is given below.
This sample study explains how to identify the key drivers from the spontaneous responses using the statistical techniques of logistic regression. In the statistical model the dependent variable should be the 11 point Likert scale from 0-10. We have segregated the audience based on the ratings for top 2 box and others. The top 2 box score is coded as 1 while the other scores are coded as 0. The main drivers listed above are also converted into binary format (since they are also categorical variables) and treated as the independent variables. The results of logistic regression can be used to identify the key drivers by identifying the drivers with significant beta values (at 95% Confidence Interval).
The technique used in this case is logistic regression however it can change depending on the kind of data set. For example – Stepwise logistic can be a better method in case we need significant drivers from a set of numerous drivers.
Conclusion
We’ve shown how open ended spontaneous responses can also be used to identify the main drivers statistically like scaled responses. As discussed above this method is flexible, captures immediate issues of the customers and can be extremely useful in case of numerous drivers unlike the scaled responses. Both have their own significance in key driver analysis and the kind of methodology used depends from study to study. However, this method can be used only in cases where we have a significant amount of open ended data to yield reliable results.
Although the article explains using open ended responses with respect to customer loyalty, it can be replicated for other studies as well which capture customer perception. Example: brand loyalty, new product launch, market perception, etc. Experience with statistically testing qualitative information by coding the unstructured responses into quantitative form helps us give more incentives to investigate different methods of capturing customer perception. Some examples of emerging media to capture the opinion are Social Media, emails and recorded messages.
This study is only illustrative. However, the methodology has been tested on actual data and found effective and consistent.
Aakriti Verma is a business analyst and Sreenath Raghunath is a process associate at Genpact


2 comments
Congratulations Aakriti and Sreenath!
Great to see this published. Congratulations!!