Over a three-part series we explain how design thinking is applied to data science projects to build data products that are economically viable, desirable for the intended users, and technically feasible. The three parts are:
- Part 1 introduced the design thinking approach and examined the difficulties faced in designing successful data & analytics solutions
- Part 2 shows why a deep business and user understanding is necessary and how the business model and analytics use case canvas are helpful tools to gain this understanding
- Part 3 details the third design phase and explains the usage of the data understanding and the data landscape canvas. It concludes with a discussion on how to blend the business, user, and data perspectives.
Understanding Data-Driven Business Models
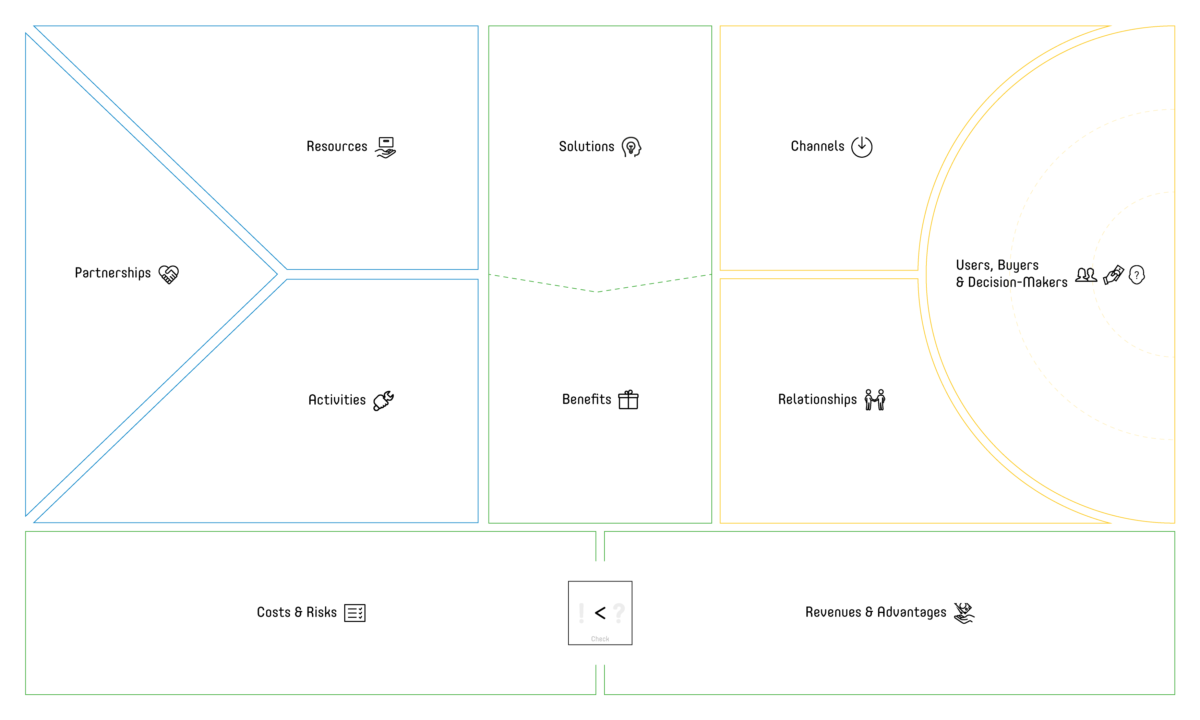
People often tend to give one of the three above mentioned dimensions more attention, or consider it more relevant, typically biased by the own expertise. That’s a dangerous mistake, each of the three dimensions is essential and if not dealt with properly can put a project at risk. Data scientists often happily leave the business side of their development idea in the hands of others and focus on the number crunching part. That’s how ‘solutions looking for a problem’ are born or products that are simply not viable from the business perspective. Let’s start exactly there, with a specialized version (see Figure 1) of the well-known business model canvas (i). Like all other canvasses mentioned in this article, it’s meant to be populated with cards in three colours:
- Green card: a positive or easy aspect
- Yellow card: challenging but solvable
- Red card: major challenge or threat
The main objective is to understand, if we can come up with something viable, we’ll thus naturally start with our intended target audience: the users, buyers and decision makers. The next step is to define the benefits we want to achieve and to describe the solution. For the entire canvas, we suggest the following sequence:
User –> Benefits –> Solution –> Channels –> Relationships –> Revenues & Advantages –> Resources –> Activities –> Partnership –> Costs & Risks
This sequence isn’t set in stone. However, there’s some logic to thinking about one aspect before the other as proposed. Once initially populated there will usually be several iterations before the canvas converges. That’s the moment to check the expected bottom line: how much money will the idea generate.

The complexity of data-driven business models is often underestimated or not fully realized. It makes a huge difference, if a product is only one-directional, two-directional, or even three-directional. The most prominent example for a three-directional product is Google’s search and advertising platform: For consumers it’s a free search engine, by using it they find websites or content they are looking for. At the same time, they’re producing valuable data, usable for advertisers via AdWords and monetizable traffic for publishers via AdSense. It’s imperative to thoroughly understand what benefit a solution provides, to whom, and how it generates revenue. Especially when considering freemium versions of a data product or free usage for a specific group of users.
Understanding Users Needs
The desirability of a data product for users is key to its economic success: if users don’t use the data product, it won’t create any business value. To foster user acceptance, two factors are critical. Firstly, the data product must address the users’ needs, and secondly, the users must trust the data product. Applying design thinking to data science development can help to solve both challenges to some extent: it helps to understand the users, because the development process is tailored around user needs and solving user pains. Furthermore – by integrating the users as co-developers into the process – it helps the users to understand the solution and can thus provide valuable feedback on potential trust issues. The trust of co-development users is not to be generalized though. They have seen the solution evolve over various iterations and had a chance to test it in a friendly environment. It’s thus likely, that they are more forgiving than someone who is touching the final product for the first time and had no exchange with the development team. A final check with a new set of test users is thus highly advisable.
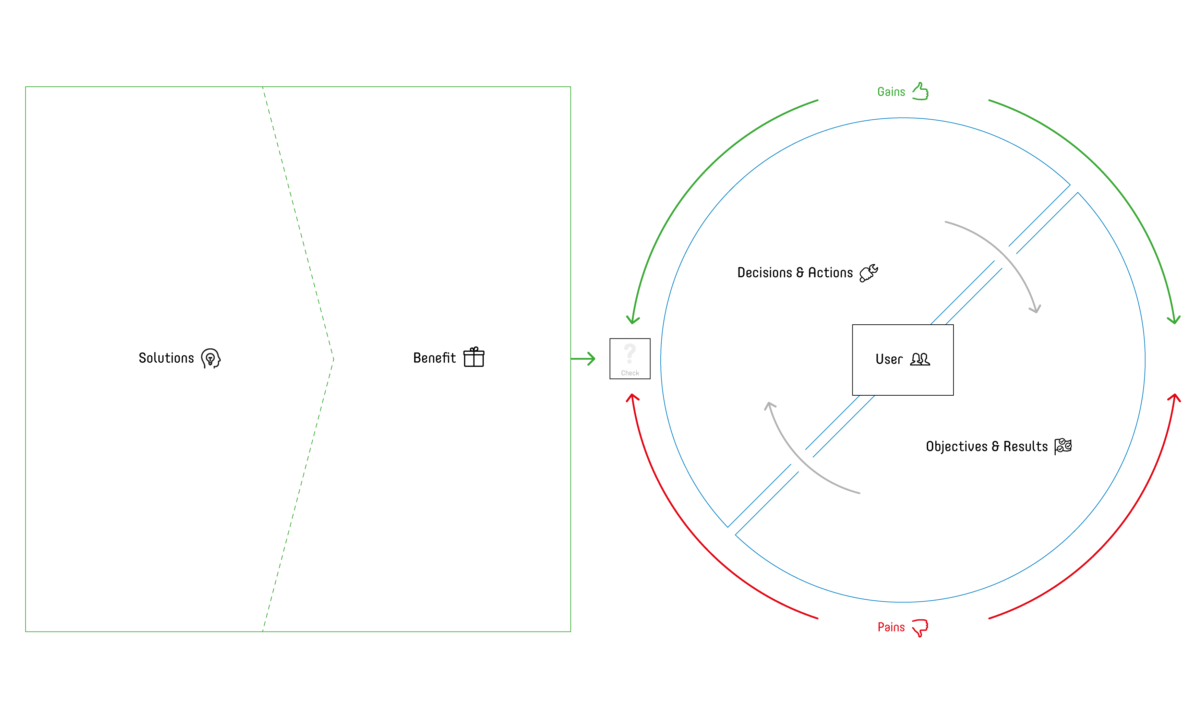
To involve the users as domain experts and to identify their needs, visual collaboration tools like the value proposition canvas (ii) have been developed. They help to design useful products by breaking them down into relevant facets. For data products the authors recommend the dedicated analytics use case canvas (see Figure 2).

A data product typically addresses one or more analytical use cases. A use case is defined by:
- The problem of a specific user role: why does the user need a specific solution, i.e. what is the goal and what are the challenges to achieve this goal?
- The solution to this problem from the user’s perspective: what help is the solution supposed to provide?
- The benefit of this solution for the users: how does the user get an advantage from this solution?
In most cases, data products address challenges in a decision-making process. A data product applies basic to highly sophisticated analytical techniques or algorithms to data. The thereby extracted information then drives a decision or directly triggers an action. The action is determined to achieve a result which contributes to an overall objective. The schematic sequence looks as follows:
Data –> Analytics –> Information –> Decision –> Action –> Result –> Objective
To design a useful data product, one must first understand the users’ objectives and the desired (key) results (known as OKR (iii)), followed by the potential decisions and actions they are allowed to take. Then we define what information (i.e. answers to specific questions) they need to take these decisions and subsequently actions. Accordingly, the analytics use case canvas is populated from left to right:
User –> Objectives & Results –> Decisions & Actions –> Pains & Gains –> Solutions –> Benefits
For example, a user role could be a social media manager with the objective to generate traffic on social media for an e-commerce website. The key results are reach and conversion (to the website). The actions are to post content and boost specific posts with ads to increase the reach. The social media manager can decide on the content, targeting and how to split the ad budget among the ads (posts) – but there’s no freedom of choice on the amount of ad budget. A critical pain is not knowing which post will be successful and a gain could be a recommendation for which post the ad budget should be allocated. A potential solution is to predict the virality (k-factor or viral uplift) for each post shortly after publication on the basis of a few user interactions and recommend those posts for ad boosting with a high chance for virality to leverage the reach with ads. The benefits are higher reach for the posts but also less time spent on the decision making.
Part 3, detailing the third design phase and explaining the usage of the data understanding and the data landscape canvas, will be published next week- 14 July.
References:
(i) A. Osterwalder and Y. Pigneur, Business Model Generation: A Handbook for Visionaries, Game Changers, and Challenger, Hoboken, New Jersey: John Wiley & Sons, Inc., 2010
(ii) A. Osterwalder, Y. Pigneur, G. Bernarda and A. Smith, Value Proposition Design: How to Create Products and Services Customers Want, Hoboken, New Jersey: John Wiley & Sons, Inc., 2014
(iii) J. Doerr, Measure What Matters: OKRs: The Simple Idea that Drives 10x Growth, Portfolio Penguin, 2018


