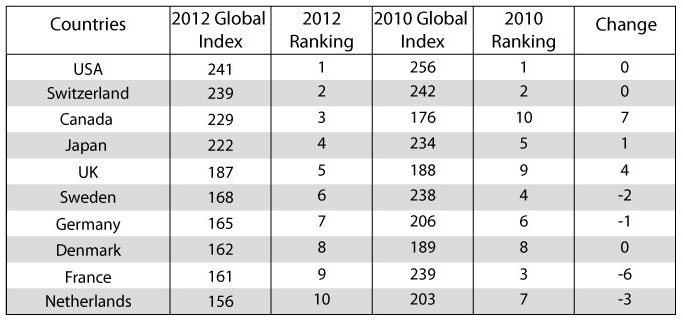
This year’s ESOMAR Global Prices Study shows the USA holding the No. 1 position it attained in 2010, as the most expensive country in which to do research – keeping Switzerland in second place.
The findings – based on fieldwork conducted between April and June of this year – have just been published in the October issue of Research World. Make sure you get your copy.
Global Index: The Top Ten most expensive countries for research
The 10 countries that are the most expensive in which to do research in 2012 are the same 10 with the highest Global Index price scores in 2010. The USA is the most expensive, followed by Switzerland, with Canada moving up seven positions to third place since 2010.
The Global Index is created by combining the cheapest option for an ad hoc usage and attitude study, with a series of group discussions – both of are widely standardised and widely quoted for, allowing a composite index to be constructed to give an idea of the rank order of costs of countries. Further information on the project quotes requested may be found below, under ‘Study Scope’.

Other countries that moved up the league in terms of being more expensive in 2012 in US dollar terms are:
- Colombia, from 33 to 23
- Venezuela, from 52 to 33
- Panama, from 63 to 45
- Peru, from 62 to 51
- India, from 65 to 55
All of the Latin American countries listed above show a corresponding growth in the size of their market research industry, as reported in ESOMAR’s 2012 Global Market Research report. It is thought that India’s move may be linked to the greater incidence of analytical “upsell” within its market.
Global Index: The Top Ten least expensive countries for research
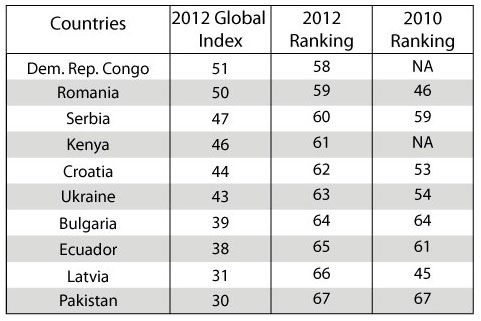
The 10 countries that are the least expensive in which to do research in 2012 are:

Countries that showed a marked movement to the less expensive end of the price range are:
- Latvia, from 45 to 66
- Romania, from 46 to 59
- Kazakhstan, from 37 to 57
- Lithuania, from 36 to 53
- Slovenia, from 34 to 48
- Philippines, from 29 to 46
- Turkey, from 25 to 38
- Portugal, from 23 to 34
While many of these markets are quite small (in overall value terms), they are all growing apart from Portugal, the Philippines, and Slovenia.
The complexities of global research
The study re-confirms that the world is a complex place. Not only do prices vary between one country and another, but the available research options vary as well. Online access panels can reduce costs compared with face-to-face and CATI (telephone), but online research is not available in every market and may not always be appropriate in every market where it is available.
Face-to-face is not widely available everywhere either. In the USA and Canada, even fewer agencies quoted to conduct in-home studies on this occasion than two years ago. By contrast, in Asia West (eg, India, Kazakhstan and Pakistan), far more agencies quoted for face-to-face than CATI.
Other key findings
- The costs for CLT (central location testing) have risen by about 20% over the last two years, and the prices for CATI have increased by 10%. However, the trend for prices of online research is generally negative.
- In the key markets (a combination of the USA, the UK, Germany, France and Japan, the five markets with the largest volume of spend), the price of online research fell, even before allowing for inflation.
- More agencies continue to submit bids for face-to-face and CATI than online, but the gap is narrowing as online is increasingly popular and CATI and F2F are both falling. If the current trends continue, there will be as many vendors of online as of the other modalities, globally, by 2014.
- Face-to-face is the most expensive modality, often twice as expensive as online, with CATI falling between the two.
One other issue that may emerge even more strongly out of the changes in the pricing of online research, relates to the perceived quality issues that surround this particular methodology. In response to criticisms about fraudulent and duplicated responses, online researchers have spent a lot of time and money improving their quality procedures. However, prices are falling and the number of agencies offering online is increasing. So will these downward price changes threaten the work being done and costs being incurred to establish (and maintain) higher standards?
Study scope and worldwide coverage
ESOMAR’s 2012 Global Prices Study aims to provide insights into the differences in pricing that exist between countries, between types of projects and over time.
This 2012 iteration of the project (the study was last run in 2010) is based on quotes provided by 633 agencies across 106 countries (29 more agencies and six more countries than on the last 2010 Prices Study).
The bids were submitted in response to a standardised set of projects comprising five consumer research projects (three quantitative, one qualitative and one utilising online communities), one B2B project and a set of commercial tariffs for staff time and a presentation. Full details on the projects and requested specifications may be found in the report.
Project 1: Usage and Attitude survey on a chocolate confectionary product
Project 2: Tracking Study on washing powders
Project 3: Computer Assisted Advertising Pre-Test
Project 4: Four Group Discussions on retail banking services
Project 5: Research Communities
Project 6: B2B Survey on Laptop Computers
Commercial tariffs: A day of executive time (junior, mid and senior) and a face-to-face presentation
The correlation between the Global Index scores for 2010 and 2012 was 0.93, implying that there is considerable similarity between these two waves of the study. This very closely resembles the relationship between 2010 and 2007 scores, where the correlation was 0.94.
Although the fieldwork was conducted in a variety of currencies, the study is reported in terms of US dollars (unless specifically indicated otherwise), using the exchange rates that prevailed on 1 June 2012.
The sample, fieldwork and responses
Agencies were included in the sample if they had an ESOMAR member or, in countries where numbers were low, if they had been nominated by their local research association or ESOMAR representative. The fieldwork was conducted between 3 April and 26 June.
In order to protect the anonymity of respondents and companies, the report only includes quotes where a minimum of three agencies responded for at least one project. As in 2010, the median was used to report the values, as it is less susceptible to outliers than the mean.
During the collection and processing of the data, every precaution was taken to protect the anonymity of respondents and companies.
The Prices Survey was conducted under direction of independent consultants, Sue York of NewMR and Ray Poynter of Vision Critical.
The full report
For full information on a country-by-country and project level, head to the ESOMAR Publications Store to consult the special report in the print October edition of Research World and the dynamic web reporting tool (free for ESOMAR members).The full report


1 comment
[…] Global Prices Study 2012: US Market Research – Price is No Object? – Sue York of NewMR and Ray Poynter of Vision Critical conducted a global price survey for ESOMAR. The U.S. remains the most expensive country for fieldwork, followed by Switzerland, Canada, Japan and the UK. […]