First published in Research World January 2009 – Reviewed by Bob Harrow, January 2011
In the rush to save cost and time, important sampling and recruiting practices have been set aside in online B2B studies. But they have a huge impact on data quality.
There are two critical differences between how telephone interview and most online access panel samples are built that may impact data quality in B2B studies. First, telephone studies typically are recruited from lists of companies that represent a target population, and each company has an equal probability of being selected. This latter condition is a defining criterion of random sampling, and the validity of statistical tests rests on it. Many factors (e.g. non-response, imperfect lists) prevent the sample from being truly random, but the result been considered a reliable approximation.
Online access panels are usually recruited using convenience sampling that is not random, but instead designed to reach the largest number of people in the least expensive way, such as Web site banner ads. This can bias data in unknown ways because some members of the target population are less likely than others to receive panel invitations although the impact of this bias on survey results is difficult to gauge. The second critical difference is that most B2B telephone studies build in respondent verification, because respondents are telephoned at their place of work and it is difficult for them to misrepresent their place of employment or position.
To examine the impact of these recruitment differences, we compared online survey data from two B2B online access panels that used different recruitment methods to build the panels. One panel was recruited from a convenience sample, and the other was recruited by telephone using random sampling.
Data from the convenience sample panel showed several signs of poor quality. Data from the telephone-recruited panel did not, and was superior in uncovering key data patterns. In fact, data analysis and measures of data quality from that online access panel were identical to those from a custom telephone-recruited random sample.
The Case Study
The data come from a B2B brand and satisfaction survey for a computer peripherals category in the US using three data sources:
- An online access panel of executive IT decision makers whose members were recruited from banner ad invitations on B2B Web sites (the ‘Online Convenience Sample Panel’, n = 640 respondents);
- RONIN Corporation’s online access panel of executive IT decision makers who as panel members participate regularly in online surveys but who had been originally recruited into the panel by telephone from Dun and Bradstreet lists representing the universe of US businesses (the ‘Online Random Sample Panel’, n = 572 respondents); and
- A Phone-to-Web sample of executive IT decision makers, recruited specifically for this survey by telephone from Dun and Bradstreet lists representing the universe of US businesses (the ’Phone-to-Web’ sample PW), n = 472 respondents).
All respondents took an identical online survey; members of both panels received an e-mail invitation and Phone-to-Web recruits were sent an e-mail link. The survey included perceptions of brand quality, brand satisfaction, brand consideration, budget allocation and attribute importance ratings. The analyses include indicators of data quality across the samples and more substantive analytics.
Data Quality Indicators
Survey completion time: Many respondents in the Online Convenience Sample Panel showed evidence of rushing through the survey – a sign of poor data quality -with 19% completing the survey in less than half the median response time of 30 minutes. Just 1% of the respondents from the Online Random Sample Panel and no respondents in the Phone-to-Web sample completed the survey as quickly. Respondents with fast completion times were removed from the Convenience Sample Panel for all analysis moving forward.
Straightlining where respondents give the same response across a series of items suggests inattentiveness. It was more prevalent in the Convenience Sample Panel. For example, respondents rated six leading IT peripheral brands on a 1-10 scale where 1 = “very low quality” and 10 = “highest quality”. 9% of respondents in the Convenience Sample Panel gave the same rating across all brands, compared to 2% in the Random Sample Panel and 3% in the Phone-to-Web sample. The high frequency of straightlining in the Convenience Sample Panel seems especially high considering that the 19% of respondents that sped through the survey had already been removed.
Bivariate and Multivariate Relationships
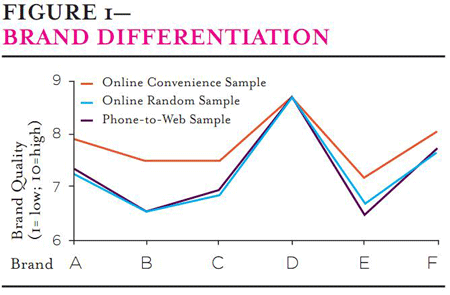
Sensitivity to detect meaningful differences: Moving on to data analyses, we consistently found that the Convenience Sample Panel data was less sensitive in detecting important findings. Figure 1 shows quality rating averages across six brands for the three sample sources. Ratings from the other two samples track each other closely. Ratings from the Convenience Sample Panel are generally higher and the distribution across brands is flatter, providing less distinction. For example, Brand C is rated significantly higher than Brand B at 95% confidence in the other two samples but not in the Convenience Sample Panel.
Masking important bivariate relationships (correlations): Excessive numbers of high correlations in the Convenience Sample Panel data obscured meaningful patterns found in the other samples. Figure 2 shows correlations between satisfaction for the four leading brands in the category (on the horizontal axis) and likelihood to consider those same brands in the future (on the vertical access). In both the other two samples, positive correlations along the diagonal suggest that satisfaction with a brand is related to likelihood to consider that brand (but not others) in the future, in line with both intuition and what we typically see. In the Convenience Sample Panel, satisfaction for a particular brand was correlated with likelihood to consider that brand as well as other brands in the future. That pattern might lead to the conclusion that there is little brand loyalty, but the results from the other samples instead suggest that this pattern is due to noisy data.
The Convenience Sample Panel failed to detect other important relationships. Correlations between satisfaction and budget allocation for the five brands for which we had the most data are in Figure 3. In the other samples, brand satisfaction correlated with percent of budget allocated to that brand, as noted by the positive correlations across the diagonals of the correlation matrices. These correlations were completely non-existent in the Convenience Sample Panel.
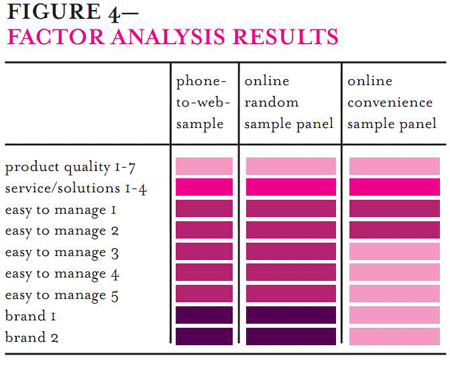
Multivariate analyses: The lower sensitivity of the Convenience Sample Panel to detect meaningful data patterns also impaired multivariate analyses. A simple example is a factor analysis conducted on ratings of the importance of 18 attributes to purchases in the peripheral category. As portrayed in the first two columns of Figure 4, a factor analysis of the Phone-to-Web data alone identified four factors from the 18 attributes:
- A seven-item product quality factor
- A factor with four items concerning available services and solutions,
- A factor of five items involving product ease of manageability, and
- A factor of two items related to brand reputation.
The same factor analysis using data from the Online Random Sample Panel (third column) reveals an identical factor structure. A factor analysis of the Convenience Sample Panel (fourth column) delivered a much simpler 3-factor structure in which the ‘Brand’ factor and some ‘Easy to manage’ attributes were folded into the first ‘Quality’ factor which suggests a simpler purchase decision process or, in any case, less discriminative survey responses.
Conclusions
The key difference between the Online Random and the Online Convenience sample panels is in how panel members were recruited, suggesting this is a key issue in ensuring online panel data quality. The Random Sample Panel had two recruitment elements that were missing from the Convenience Sample Panel: random sampling from lists of the target universe, and telephone recruitment that verifies respondent identity. The data do not allow conclusions about which is most important in driving data quality.
This case study is consistent other work suggesting caution when looking at panels built from convenience samples recruited online. This caution has led researchers to develop methods to purge datasets of ‘poor respondents’, be they inattentive, duplicates, or fraudulent respondents. The effectiveness of these measures remains unknown, and we remain skeptical because it is not possible to identify how convenience sampling or online recruiting bias data. The good news is that our analyses suggest that data collected from online panels that are built using traditional sampling and recruitment methods can produce high quality data and still benefit from the flexibility, speed, and economy of online data collection.
Bob Harlow is the owner of Bob Harlow Research and Consulting.


