● Find out how using Bayesian statistics can complement more traditional market research approaches by giving you probable, rather than deterministic, insights.
● Understand ways that this model can help you better profile your target audiences and compare them easily to other relevant groups.
● Examine practical applications, using modern technology, for putting the Bayes theorem to work in bringing your most interesting insights to the forefront.
Black and white thinking doesn’t work in a world full of greys. Yet, traditional market research is based on dichotomies – looking for that stark contrast, that stand-out percentage, that enlightening insight on which we can base business action. We collect a sample of individuals for our surveys and hope they’re representative of the wider population. From the insights we uncover from this group, we generalize about a population and make decisions based on that generalization.
Is this the right approach? Scholars have been exploring this question for decades, putting forth a number of solutions including new ways to approach statistical analysis including a Bayesian statistical model, which I discuss here. The theorem itself was developed more than 250 years ago. Now we have the computing power to put it to use more practically.
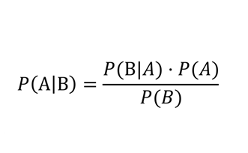
Bayesian models recognize that we live in a world of continuums, not averages. Bayesian statistics are based on Bayes theorem, a mathematical formula that calculates conditional probability, or the likelihood of “A” occurring, conditional on “B.” From a market research standpoint, this probability-based approach makes sense over “yes or no” research.

When B represents data and A represents parameters in a statistical model, Bayes theorem provides the basis for Bayesian inference. A key feature of the Bayesian approach is the ability to incorporate prior knowledge or beliefs into the analysis (the p(A) in the Bayes theorem above) which is updated by the data that we collect from an experiment or survey. The result is a “posterior” probability distribution for the parameters in the model (such as the mean and variance) given the data we have obtained.
Since the Bayesian approach expresses uncertainty in terms of probability, a Bayesian “credible interval” is a range for which the probability of including the true value (e.g. of a mean) is, say, 0.95. Thus, we can say that there is a 95% chance that the credible interval contains the true parameter value.
How does it benefit market researchers?
Using Bayesian statistics, we can more usefully represent research data which isn’t black and white. It allows us to perform a series of statistical tests on specific groups and compare values for each group with the values for those not in the group. Bayesian statistics allow us to calculate the probability that the group value is greater (or lower) than the values held by other groups.
This methodology can be valuable, as it can help you better profile your target audiences and reduce the possibility studies will get rejected because they don’t meet the acceptable significance test. You can uncover the “descriptors” or characteristics that best describe your group and compare these with other groups. For example, you can profile those who prefer your brand and then compare that profile with the same for all the other brands. This allows you to dive in and see which brands are the most and least like yours from the customer standpoint. Similarity can be measured by various measures such as Robinson’s Agreement Metric. These are descriptive statistics that can be used on data organised into groups or classes. Agreement assesses the relationships between group items, but, as the name indicates, the emphasis is on the degree of concordance in the results between two or more groups of the items of interest.
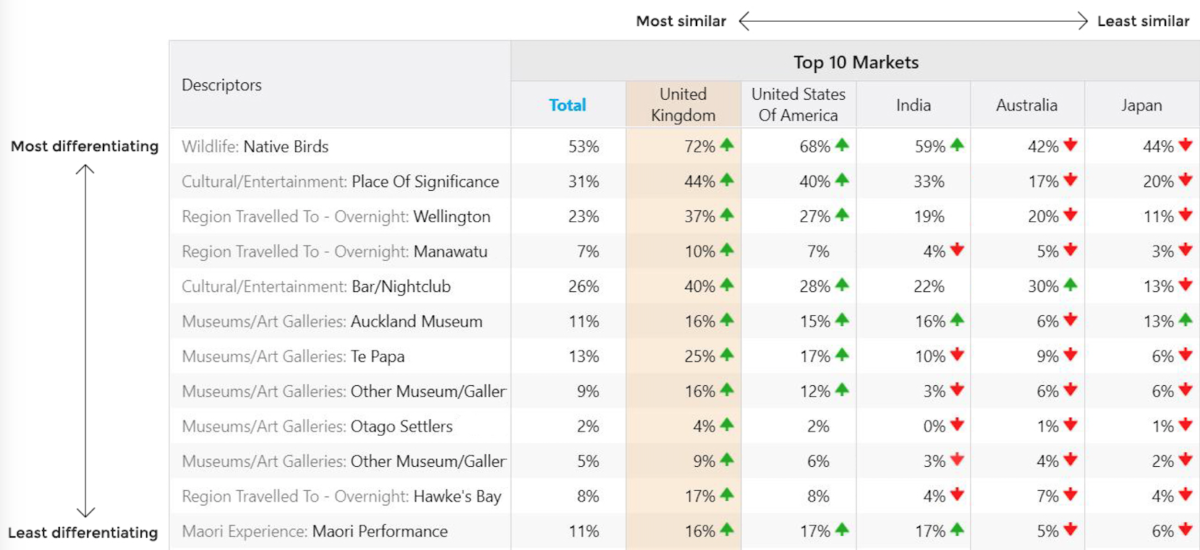
Let’s imagine that we have global data from the New Zealand International Visitors Survey, and we want to uncover what the data can tell us about visitors to the area from the top 10 target markets. The Bayesian model allows us to perform statistical tests on each descriptor variable (e.g. age, gender, income, travel style) to calculate the probability a group value is greater (or lesser) than the value for those not in the group. We can then compare the cell value for visitors from the United Kingdom to visitors from the United States, Germany, Canada and all others.
(Click on the image to enlarge in a separate window- ed.)

In this graph, we’re examining the probability of each market being like the United Kingdom (the selected Target Market). Markets are ranked left to right based on similarity, with differentiating activities running top to bottom. Along the top axis, for example, we can see that the U.S. and India are most similar to the target market, with similarity decreasing for Australia and Japan, specifically regarding the first three descriptors on the left hand axis. Strong positive or negative differentiation indicators are shown with arrows.
Contrast this with the classical approach which yields a simple yes or no as to whether the group values are different. When conducting multiple tests for differences between groups using classical statistics, the tests can start to fail, whereas Bayesian models do not suffer this same type of breakdown. This more modern foundation helps to automate tests, allowing for a richer, more useful interpretation of information.
Putting Bayesian statistics to work
The example above shows how Bayesian models can help uncover deeper insights. It opens doors for us to approach research projects differently. Unless you are a genius mathematician, applying this statistical model to a project might feel out of reach. With powerful, user-friendly technology, we can start to unlock the potential. Bayesian statistics can underpin new technology, helping market researchers by automatically bringing the most interesting findings to the surface, fostering a deep understanding of target groups. This method quickly focuses attention on the data that matters the most.
From a mathematical theorem that was developed nearly 300 years ago, to a foundation for market research data analysis today, Bayesian statistics hold promise for allowing a better understanding of the massive amounts of information we now have available to us. Technology developments are making Bayesian analysis accessible for market researchers and allowing them to uncover more accurate representations of research data that is not black and white.


