The changing ad landscape
Paid Content / Advertorial
By Jackie Lorch
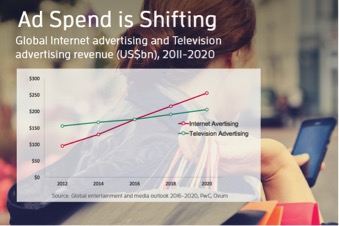
Advertising research is undergoing radical change as ad spend continues to grow steadily, but that spend shifts from offline to digital. Some facts:
- Global digital ad spend is projected to grow from $194 billion in 2016 to $335 billion by 2020.
- Last year digital ad spend was set to surpass TV for the first time.
- A Nielsen survey found that 18-24 year olds spent more than an hour less each week watching traditional TV in Q4 2016 than they did in Q4 2015.
Against this backdrop 2017 has seen demands for more reliable ways to measure digital advertising. In March, Procter & Gamble threatened to stop spending money on digital platforms that don’t have industry-standard audience measurement systems in place by the end of the year. Marketers urgently need tools to accurately measure their growing digital ad spend.
Do you know who sees your online ads? Can you prove you have the right audience for your content?
Astonishingly, over half of all online advertising today isn’t seen at all, by anyone.
This isn’t the fault of the advertiser, it’s a function of where the ad is placed on the screen. It might show up outside the browser window, (for example “below the fold” or outside the area that can be seen without scrolling) or might not load properly onto the screen. Even the ads that can be seen are often not seen by the people they were intended for. Until recently when your ads were displayed, where they were being displayed and who saw them was something of a black box. Being able to reach out and speak to the people who had definitely seen a digital ad was impossible
There have been tools available to provide data on exposures, but none that effectively connect viewability data to rich audience data and allow advertisers to layer on top of that the ability to reach out and survey people who have definitely seen the ad as well as those who have not. This has created a big knowledge gap for marketers who need to understand, for example, what peoples’ role in decision making for product purchase is. Specific survey data helps digital media marketers and advertisers prove their work, and helps brands understand the ad’s impact and ROI.
There is also a critical need to know cross device impact between phone, laptop and tablet viewership, so advertisers can understand the total consumer digital footprint. When we have this information we can start to see a picture of the whole person – maybe they view an ad on their phone in a shopping app, or see it while playing a game on a tablet. Today, using large research panels, we can collect data across multiple devices, then connect up all that data to a single person on a panel via the use of cookies, then target that person for further research.
Before we had these tools combined with the power of very large research panels, we had to rely on recall – which is far from optimal. It is very difficult for someone to remember what ads they have seen – and almost impossible for them to remember when they saw the ad, on what device, and within what context.
SSI’s Campaign Optimizer is one of the tools that today combines all this passive data with survey data so advertisers have a connected data set.
How do these tools work specifically?
First, each ad in a campaign must be tagged for identification. This is done in conjunction with the agency, before the campaign launches. Then after the ads go live, a multitude of stats can be made available on who saw the ad, when and where. The data can be reviewed in reports, or, ideally via a real-time dashboard. Information on people who saw the ad – their demographics, geography or other non-personally-identifiable data, is pulled in from the panel company’s records.
Answers to crucial questions
This passively collected data helps answer key questions including:
- Did the right people see the ad? Nielsen reports that in the UK campaigns only reach their target audience 47% of the time.
- Did the ad have the intended impact on the brand, the product or the candidate?
- What should I do to optimize my digital ad spend? Where should I cut? Spend more?
- How long was the ad in view?
- How many times did someone see the ad?
Layering survey data on top, we can answer more questions:
- How did the ad impact awareness?
- Which ad was key to influencing that awareness?
- How did people feel about the ad?
The technique also allows advertisers who use programmatic advertising to get full transparency on who is seeing their ads and where. They can understand the result of that programmatic effort – and the data may even reveal a new previously undiscovered target market.
The power of combining passive and active data
Campaign optimization tools are an example of a great marriage between passively collected data delivering the “Who?”, “What?”, “Where?”, “When?”, and survey data delivering the “Why?” and “What next?” Armed with this new, reliable data, advertisers can be vastly more confident in making their digital ad decisions.
Jackie Lorch is Vice President, Global Knowledge Management at SSI.
Jackie Lorch (#JackieLorch) joined SSI in 1990. She is a frequent speaker at industry events, colleges and universities, especially on research quality and the participant experience. She is a US ESOMAR Representative, MRII board member and in 2014 was named one of “20 Researchers You Should Know” by Research Magazine.


