Over a three-part series we explain how design thinking is applied to data science projects to build data products that are economically viable, desirable for the intended users, and technically feasible. The three parts are:
- Part 1 introduced the design thinking approach and examined the difficulties faced in designing successful data & analytics solutions
- Part 2 showed why a deep business and user understanding is necessary and how the business model and analytics use case canvas are helpful tools to gain this understanding
- Part 3 details the third design phase and explains the usage of the data understanding and the data landscape canvas. It concludes with a discussion on how to blend the business, user, and data perspectives.
Understanding Data Assets
As soon as it is defined which information from the data is to be used, the question arises where this data can be obtained to ensure the feasibility of the planned product or solution. Many projects have gone terribly wrong because the available data never contained the required information in sufficient quality – or even worse – at all. The data landscape canvas (see Figure 3) helps to identify data assets as well as data gaps.
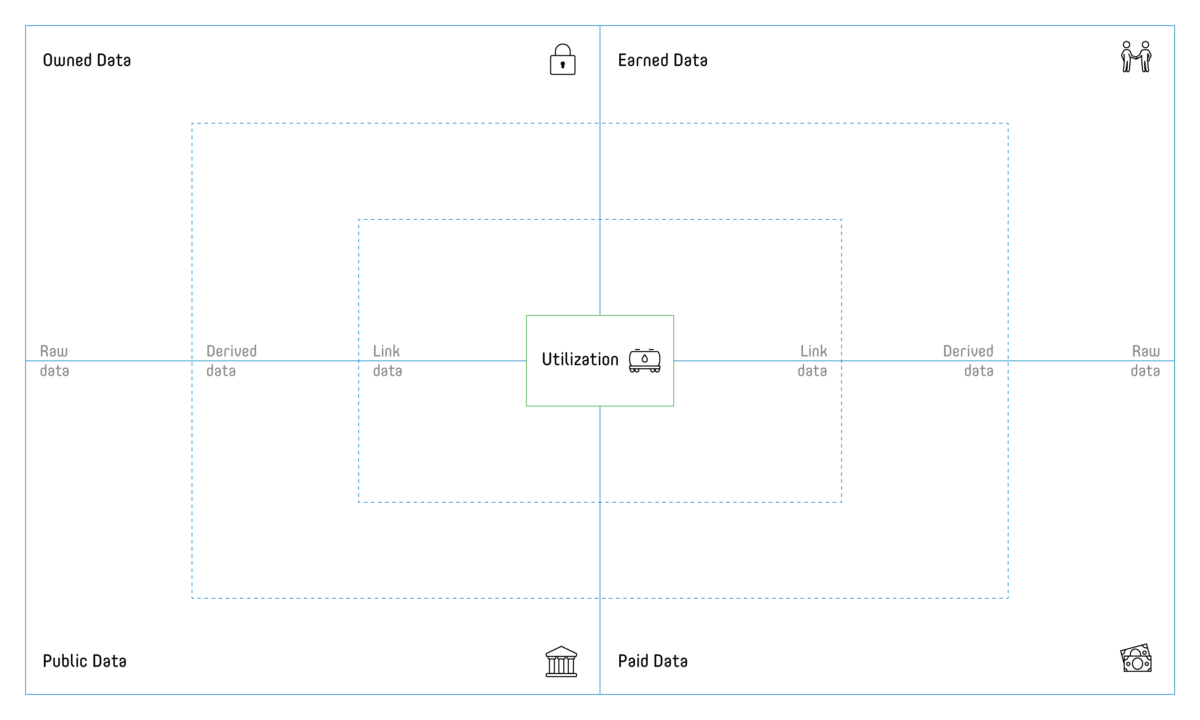
The exploration of the data landscape should start with the specific information need and thus data expected to contain this information in focus (e.g. copied from the analytics use case canvas). The following three scenarios can occur:
- The required data is available and accessible: green cards for data assets
- The required data is available but currently not accessible (due to technical, legal, or organizational challenges): yellow cards for data projects
- The required data is neither available nor accessible: red cards for data gaps
It has proven very helpful to categorize the data assets regarding source and ownership (cp. the four quadrants on the canvas):
- Owned by the organization
- Earned from customers or suppliers
- Paid for with money or with data (i.e. within a data exchange)
- Public provided as e.g. open data
Legal restrictions on the usage of specific data assets typically increase while the exclusivity of the data decreases clockwise from owned to public data, although even owned data can come with significant usage restrictions. It’s highly advisable to carefully assess the legal situation and consult with experts, to avoid dangerous misjudgements.
Depending on the generic type of data, the required information can be buried deep or easily obtainable. Each data asset should thus also be classified regarding its generic type:
- Raw data are in their original form, be it stationary or streaming data
- Derived data that are already processed, transformed, e.g. aggregated, filtered, anonymized, normalized etc.
- Link data that connects the data sources e.g. by providing database identifier mappings.
These three generic types can be extended, if a more granular classification is required. Some data scientists might for example call for an additional meta- or master data category.
All the steps outlined so far will not replace thorough signal tests with each relevant data asset. We’ve often experienced the riskiest assumptions of projects being that the required information is contained in a useful shape and form in obtainable data. No matter how highly the quality and value of a data asset is praised, always check if it contains the information required in sufficient quality and quantity.
How to Blend the Business, User & Data Perspective
We’ve now illustrated how the viability, desirability and feasibility of a data product can be analysed. By now it should be obvious that before one starts building a data product, it has to be designed properly. Otherwise the risks of developing an analytics solution that creates no economic benefit, is not used or accepted by the users, or faces problems with data availability are substantial. When following the outlined three steps approach of developing business, user and, data understanding it is likely to regularly encounter open questions. It might for example prove challenging to clearly define the user’s overall objective. Persistence and many iterations of user sessions can be required to get to the core of what they really want to achieve.
Critical assumptions about the data quality can evolve from minor concern to major threat for the entire project. Those have to be addressed, all assumptions have to be checked thoroughly. Sometimes this is done in a dedicated experimentation and data exploration phase that follows the initial design. Experience has taught us that testing critical assumptions should always be a top priority and is clearly not a task for “later”. If a critical assumption can’t be validated, it is clearly better to go back and repeat the understanding cycle instead of going forward, burning through a lot of budget and time whilst simply delaying failure in the end. The design thinking motto “fail early to succeed sooner” also applies in particular to data (design) thinking.
Data thinkers should not be afraid to bounce back and forth between business, user and data understanding. The presented canvas tools help to collaborate during this journey and to visualize the three dimensions. All tools are publicly available under public license (creative commons).