The day after – 1st observations in the UK after the ease of restrictions
London. We’re all struggling to understand what a post COVID-19 world will look like. Of course, it’s still far too early to understand this. However, we can begin to understand what’s been impacted and how, with the ease of the lockdown.
In this issue of our lockdown diary, we deliver our first observations of the changes (or not) in online behaviour. This is based on data collected on 15th June 2020 – the date the UK government eased the lockdown guidelines.
On observing this web navigation data*, we can start to draw comparisons between the online behaviour during and after lockdown. We observed 4 different situations:
| Decrease during lockdown | Increase during lockdown | |
| Post lockdown decrease | Negative impact | Back to normal |
| Increase post lockdown | Normalization | Positive impact |
1. Negative impact
Here we have websites whose number of visits went down during lockdown and which kept on decreasing once the lockdown eased in the UK.
We found three categories. First vehicles (autocar.co.uk, carbuyer.co.uk, carwow.co.uk…), which is not a surprise! Cars and lockdown aren’t the perfect match. And even throughout this time, for various reasons, from money to the environment – buying a new car is not a top priority.
But more surprisingly, we found also two unexpected categories of websites which correspond to this definition: health related websites (healthline.com; nih.gov,… ), and news and media (bbc.co.uk; dailymail.co.uk; , telegraph.co.uk…).
To ensure our hypothesis was correct, we analysed the reach of three main news websites in the UK (The Sun, The Telegraph, and BBC). For all of them, we found the same pattern: people have been overloaded by information about COVID-19. At the start of the pandemic, people were eager to inform themselves. But, by the end of March, the thirst for news had declined.
2. Back to (new) normal?
Some websites have seen huge visitor levels during lockdown. This is because the range of socialising options was limited. Therefore, quick ways are to watch TV shows or movies were in high demand. As of now, either we have more options to be entertained (in-person) , or we have to get back to work. Resultantly, there’s less visits on entertainment websites now than there were during lockdown.
The same dynamic can be observed for food and recipe websites – which saw increased visits during lockdown. This has now decreased. Either because we are out of home more than we were before, or because we have less time for cooking.
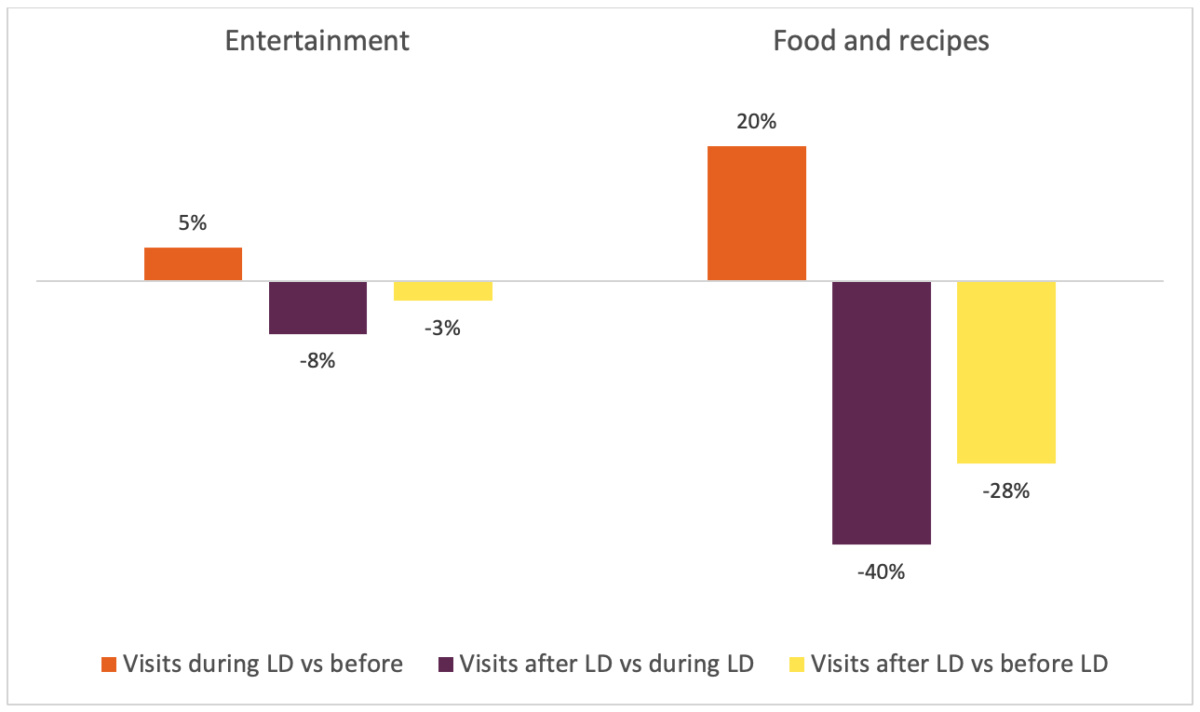
However, the situation isn’t the same for these two categories of websites.
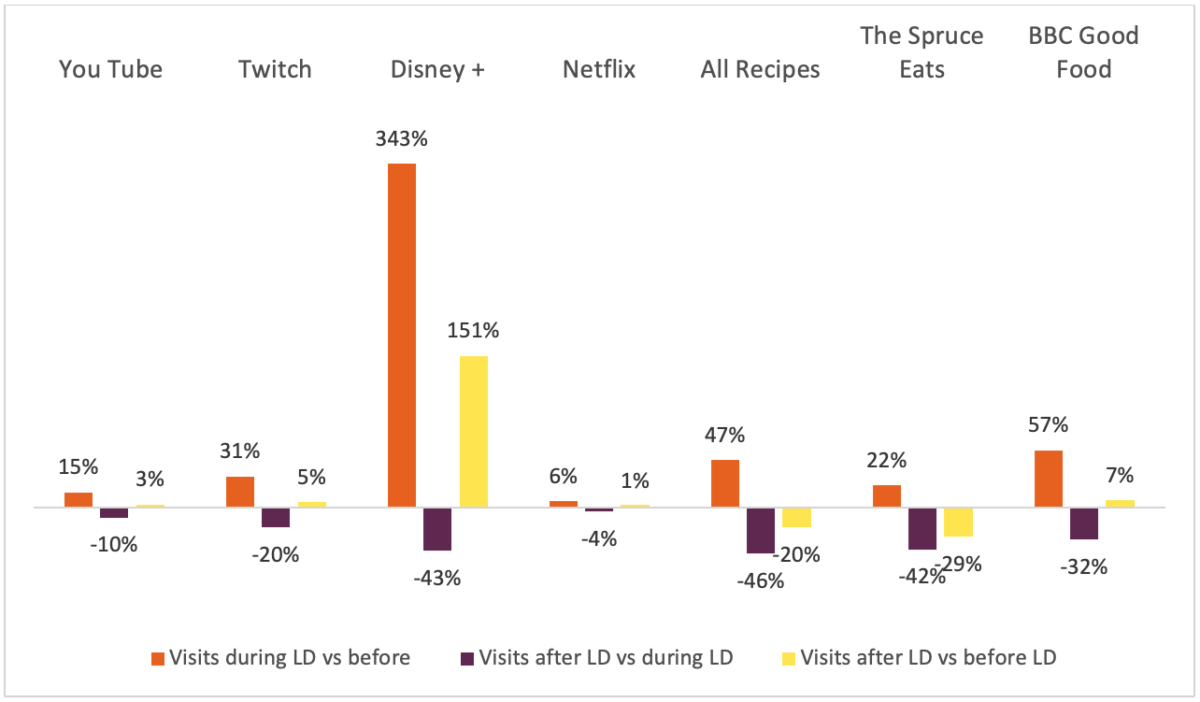
For entertainment websites, the “new normal” looks almost the same as before. For some of the main entertainment websites, the number of visits after lockdown is like before lockdown (except for Disney+ which was launched right after the lockdown was enforced).
For food related websites, the situation is different. The number of visits after lockdown is lower than vs. lockdown. The suggests the British suffered an element of boredom, cooking during lockdown, as after having used a lot food related websites during lockdown, they currently visit them significantly less (NB: at this stage of the lockdown being eased – restaurants are still closed in the UK). Does it say something about the new normal, or is it just a momentary period: are brits fed up of cooking, and for how long?
3. Normalization
Some activities stopped entirely during lockdown. For example, no football games took place so there was less sports related news and less betting opportunities. Since the Premier League re-started and Liverpool won the championship for the first time in 30 years. In less entertaining areas, it was meaningless looking for a new job or a flat during lockdown. Since regulations have been eased, searches (for a job or a flat) have risen
4. Positive impact
Last but not least: those who took advantage of the crisis and which are benefiting from the situation: of course this is based on the activity of the given websites (per se, and by comparing different periods of time) and doesn’t necessarily mean that their bottom line got better.
Here we found websites whose field of activities are still strongly related to what we observed during lockdown.
We found 4 examples of websites which might be insightful.
- Greenpeace.org is interesting in this case: does it reveal the increasing importance of ecology in the UK, or an increasing interest for this NGO?
- Decathlon, which has got media attention during lockdown for having tweaked its diving mask for medical purposes…. Could now see the benefit of increased web traffic
- DHL, as courier services, reveals the increasing usage of e-commerce among customers (what we measure with our tracking software).
- And Master of Malt (a whisky related website): we know that some of us drunk more during lockdown and maybe haven’t reduced their consumption just yet…
*Since 2016, a percentage of our UK panel has accepted to share their navigation/app usage data with us. They all have installed a software/an app which monitors their online activities. Here we compared the measures obtained since the 1st of March 2020, national representative sample (gender, age) n=1,983, data from desktop and mobile (besides apps).