Tim Stock and Marie Lena Tupot
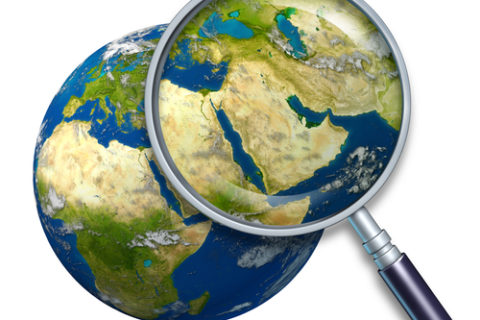
We talk a lot about icebergs when we are attempting to visualise culture and understand its seemingly hidden dynamics. But the way we use icebergs to illustrate culture is not indicative of culture at all. In fact, it’s not even indicative of icebergs.
Culture is a manifestation of a human system of signs. It is not immutable. It is not permanent. Neither are icebergs. Picture this reality: 40,000 icebergs of various sizes and shapes breaking off each year, traveling erratically with the wind and melting. Icebergs form a system of movement patterns. So does culture. Looking at one iceberg to explain the dynamics of culture is an unfortunate simplification.
At scenarioDNA, we map semiotic data. By semiotic data, we mean the signs and symbols put out into the world, knowingly or not, by human beings. The human-ness of visualising data lies in the randomness of the data and the patterns it creates or avoids. Our purpose in mapping that data is to see the systems that are evolving and help expose tensions that might be otherwise pale.
If we only see the iceberg as a solitary mass, we lose the opportunity for innovation. Seeing synergy, tension, diversity and void gives us places to start asking questions, probe and think: “What don’t we know?,” “What might happen next?” and “Why?”
Yes. “There are things we don’t know we don’t know.” (Thanks for that, Donald Rumsfeld.) We need to get to the point where we know all that we could. The goal of a visualization should be to flush out and conjure up all the things in our power to know. Mapping is powerful.
Once clients can see the system that exists, it clears and opens their vision. It gives them an irrefutable lens to work with. And we can begin to think beyond their initial limits.
Because exploring culture is an inductive process, we are constantly mapping its patterns and evolution across genres. We don’t wait for briefs to start looking for evidence. This inductive process is what separates semiotic thinking from design thinking, which follows a more deductive approach. Whereas design thinking lands on a new concept, semiotic thinking allows clients to see the cultural system over time and confidently invest in multiple forward-thinking scenarios.
Mapping is more than looking for the cultural drivers of the moment. We’ve used mapping in a variety of ways. The following are six notable cases where our mapping foretold compelling new thinking that helped brands, media and countries make better sense of the worlds and cultures around them. Mapping lends context.
Mapping can identify yet-unseen cultures and untold stories. Mapping can identify the essence of culture. Mapping can identify information voids. Mapping can make sense of gestural and non-verbal communication. And mapping can reveal cultural nuances. Mapping lets us forecast a sustainable future.
Mapping proves that objects are not incidental.
The objects we use to express ourselves are critical to identity. One item out of sync can alter the messaging we want to convey. About three years ago, a global packaged goods brand reached out to us to help them better understand its regional territories. The brand recognised that it needed to better localise its messaging but had not yet captured what that looked like.
To bring the regions to life, we examined objects of power and desire that intercepted the brand in the UK, Brazil, Russia and Saudi Arabia. We worked with local analysts to cull input. We then mapped the analyst’s examples of the types of objects according to each country and its cultural dimensions.
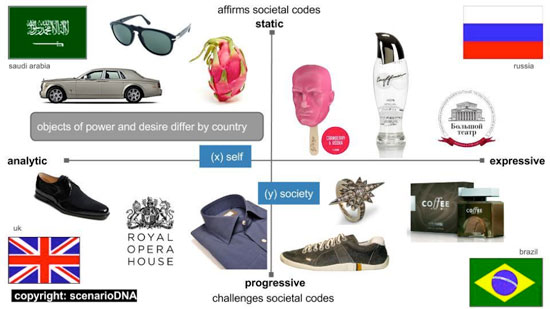
Tailored design with modern shape and color showed up for the UK. A rich, but relaxed, earthiness was found in Brazil. Objects in Saudi Arabia portrayed an exotic distance. And, in Russia, unwavering legacy sat alongside dry humor. The ability to compare and contrast the objects by quadrant gave human dimension to the regional nuances.
This, along with exhaustive visual research, gave the client renewed perspective on marketing, and turned a formerly heavy handed cliche approach into a more integrated lifestyle message more in keeping with the brand identity.
Mapping can identify the essence of culture.
For a couple of years, we have been using semiotics to establish the brand positioning for Russian Standard Vodka. For the brand, we have explored the semiotics of vodka culture from a number of angles starting with the codes of the various generations engaged in drinking and also looking at the story of the brand itself — in order to understand what the brand might really mean to people outside of Russia.
The map here demonstrates how Russian Standard Vodka sits, semiotically speaking, among the sea of vodka we have in the US. It entered the market during the crescendo of flavored vodkas. Data was culled from online sentiment and cultural perceptions.
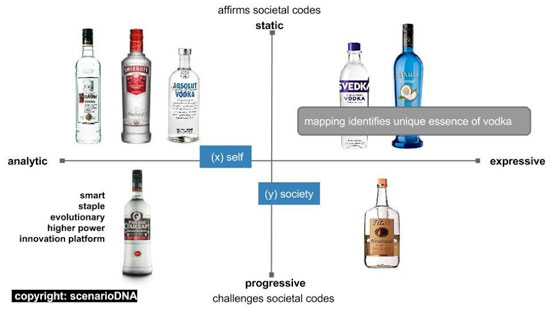
Semiotics allowed Russian Standard Vodka to forge new territory, and allowed its team to frame a uniquely Russian brand for relaunch in Europe and USA by returning to the fundamental values that make the brand worth talking about and sharing with others. Brand awareness increased by 30 percent.
Mapping can identify evolving cultures.
Back in 2009, the semiotic work we conducted for agency Cossette for Dorel/Cannondale bikes won the agency a $20million AOR. We started by looking at Cannondale and understanding where the competition sat as well as where its sister brands were (Schwinn, Mongoose and GT).
Today, we hardly think twice about bike culture, bike lanes and bike commuting. But, just five years ago, most of the talk teetered from Lance Armstrong to recreational biking. We were handed a foot-high stack of survey data from bike retailers to glean insight from. We crossed reference that information with social media postings. Bikes were evolving among people, but not at the retail level. Bikes were being hacked and augmented and used in ways no one was discussing — bike jousting, bike moves, anyone?
Our initial cast out for information eventually lead us to urban planning. There, within community studies, we found a pent-up demand for bike commuting. The semiotic symbols were all there, but the language of the category and the codes of bicycles had not yet been set in the minds of marketers. We mapped the archetypes of bike culture that we uncovered as seen in this semiotic map.
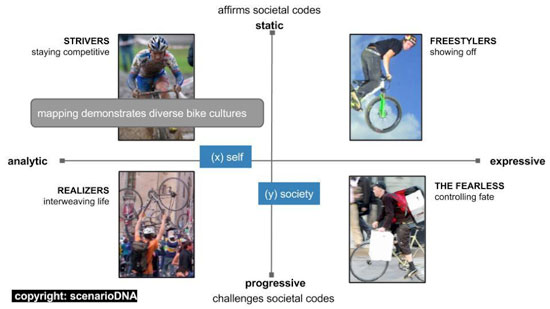
Semiotics helped the agency team push beyond their present knowledge and see the pattern of evolution as it was happening. It helped give the team a point of view that allowed them to differentiate each brand and give it breathing room.
Mapping can identify emerging stories.
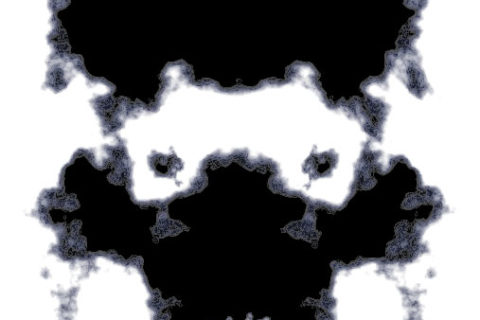
About two years ago, we worked with Wieden + Kennedy to uncover deep insight for NIKE into the shifting perception of sport among youth in Japan. We collected data by tracking social media and conducting infield ethnography with teens in Tokyo, Osaka and Kamakura.
Mapping the words, signs and imagery that we saw infield, it quickly became apparent that there were a multitude of sports stories emerging. A critical observation, seen in the map here, demonstrates a breaking away from traditional bukatsu sports into more visceral expressive scenarios.
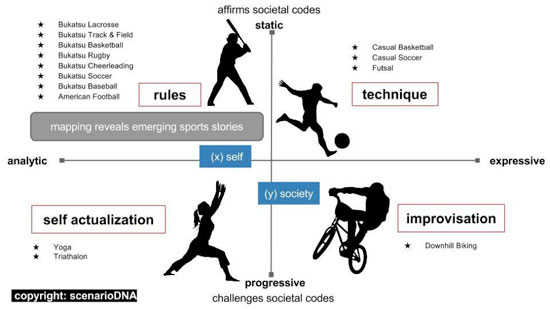
The resulting study helped NIKE visualise where kids were moving and understand what it means to be young and Japanese.
Mapping can identify information voids.
Most recently, we had been involved in an education grant looking at higher education curriculum. The exercise prompted us to deploy our Culture Mapping method to visualise university syllabus. We recognized that there had been a lot of talk about education reform, but no one was looking at what already exists. Courses live as siloed as ever, never teaching students how to move out into the real world.
We tested our theory by analyzing course descriptions from a sample of 1000 free online classes found on Open Culture. When a syllabus is mapped according to our culture mapping, classes consistently fall across four quadrants: theory; technique; outreach; and reporting. These quadrants become education archetypes, reflecting classroom learning and community engagement. Today’s students need educational experiences from each quadrant for a viable education.
Mapping the Open Culture-listed courses, all from respected institutions, demonstrated that the courses available online are sorely lacking in outreach. No surprise.
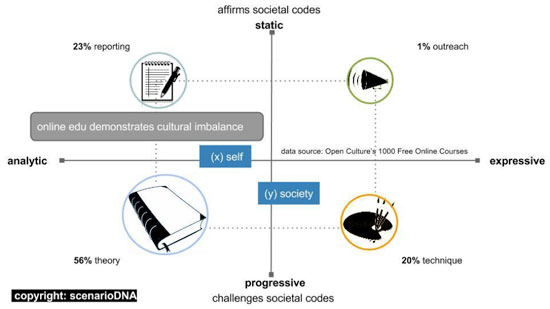
However, the imbalance also represents the state of most curriculum. When a student’s education lacks balance, it is either because they do not know how to structure their choices or the breadth is not available. If we can map a university’s syllabus according to the cultural language of its course descriptions, we can see curriculum evolve as a system and begin to reveal its patterns of strength and weakness.
An analytics toolkit was the result of this exercise. It visualizes higher education syllabus according to culture.
Mapping can make sense of gestural communication.
Gesture is so important to watch and read. Social media photography is one of the elements we watch consistently. During the recent Umbrella Protests in Hong Kong, a raised hands gesture appears. It was previously seen at the Ferguson protests in Missouri. The Ferguson protesters used the gesture as defiance, reminding police of the line they crossed with Michael Brown.
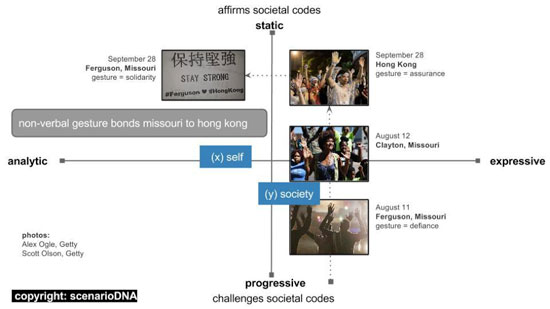
The Hong Kong protesters used the gesture as an assurance to police that their intention was peaceful. In spite of the difference in meaning, the raised hands gesture connected Missouri to Hong Kong. Solidarity messages began to appear in Ferguson encouraging Hong Kong protesters to stay strong.
Noteworthy in the Hong Kong imagery is how prepared students were with protective masks, coverings and other aid to alleviate the effects of pepper spray. From umbrellas to saline drops, posted imagery consistently demonstrated concise and proactive organisation.
There is a clear cultural delineation between the two protests that’s not evident from images alone. Looking at data without context is a big pitfall that happens all too often.
The fundamental challenge
In any case, the fundamental challenge of the 21st century is to make sense of human ambiguity. To that end, every company is charting futures to know where the opportunities are. Semiotics helps us curb our tendencies to land on singular ideas, on solitary icebergs. It helps us be comfortable in riskier territories, in investing incrementally. It helps us propagate great ideas that we don’t yet understand or see — to be assuredly provocative and impactful. Leveraging culture mapping to frame semiotics provides the critical context that is too often overlooked.
Innovation is wasted by recycling old cultural frameworks from the last 50 years. Even for icebergs. In France, four young architects are at work creating a system of floating cities irrigated by icebergs. (That’s plural icebergs. Not just one.)
Tim Stock and Marie Lena Tupot are founders of scenarioDNA based in a New York. Tim Stock can be reached at @timstock