Here’s a potential scenario – you did an extensive advertising study and found an interesting pattern in the correlation matrix:
- Behavioral KPIs (Visibility, attention, and emotional reach)are correlated among themselves
- Survey questions (Recall, likability, brand fit and social media fit) are also correlated
- BUT behavioral KPIs and survey questions do not correlate as much!
What does this discrepancy mean? And how do you make sense of it?
Let’s get back to the basics first.
In statistics, correlation is any type of relationship between two variables. A positive correlation means that if one variable goes up, the other variable goes up, too – a negative correlation meaning the opposite.
A strong correlation in your behavioral KPIs for a single ad means that if many people noticed your ad, it was more likely to have high attention and emotional reach as well. Conversely, your ad might perform well in a survey that measures the conscious attitudes of the respondents – they really liked the ad, found it to fit the brand, and could remember which brand it belongs to afterward.
But when you compare the behavioral and conscious KPIs, you find that their correlation is low – if an ad did well on the subconscious measures, it doesn’t mean it would perform well on the survey measures, and vice versa.
There’s three possible reasons for this:
- Surveys aren’t relevant
- Behavioral research isn’t relevant
- OR that both are valid, complement each other, and significantly increase predictive power
Conventional and Behavioral Methods Can Have Conflicting Results
If behavioral and conventional methods have a low correlation, from a statistical point of view, this means that they measure different things; and sometimes (not always), they can have conflicting results.
Behavioral KPIs show the actual measurement of how an ad is perceived in the appropriate context. It relies on the underlying mechanisms of our perception, that have a different set of prompts and cues that help us notice things. That’s why ads need to attract attention and get seen first, even to have a chance of relaying a message to its intended audience.
A survey, on the other hand, lets us take our time, evaluate the ad consciously, giving us an account of the ad’s strong and weak points, and its potential IF the ad is noticed.
Uncorrelated Data is Actually Useful – It Provides a Complete Picture
What do we mean by saying that both sets of KPIs are relevant? They are useful for the goal of all advertising research – predicting effectiveness.
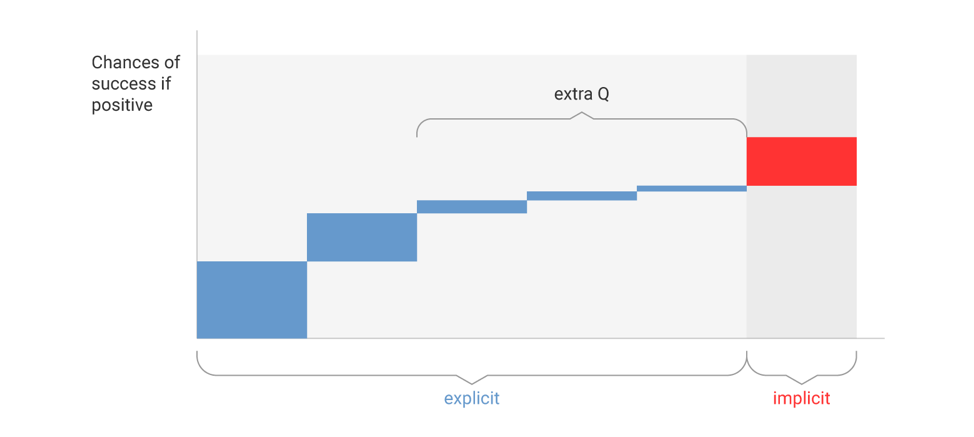
If you’re conducting research and all variables in a group are 100% correlated, that means you only need to have 1 point of data to predict all the others – essentially all the different variables you are testing don’t add value.
To understand and predict what will happen, having uncorrelated variables like this is a blessing in disguise. The complementing measurements will paint a complete picture in your study, and bring about better predictive value (or a higher R2) – assuming that both variables are important.
For example, if your survey results show that the likeability for the tested ad is high, and you are considering adding additional KPIs to the study:
- Including more correlated survey KPIs (e.g., brand fit, channel fit) > Will not add that much value since it doesn’t help conclude whether the ad will perform well.
- Introducing an uncorrelated behavioral KPI (e.g., visibility in context) > Will add significant value because no matter how liked your ad is, if people don’t notice it, you are wasting money. This type of insight is truly precious in business.
Too Complex to Explain to Internal Stakeholders – Let’s Just Skip It?
Doing this would be incredibly wrong. Many studies show that combining behavioral and conventional measurements increase predictive power by at least 40%. Not measuring the behavior is the same as ignoring essential data. Not obtaining this data does not change the facts – and it will arguably be worse, as you do not know just how bad the stimuli might perform on a specific KPI. Still, sometimes, it is hard to explain why it is better to include behavioral KPIs instead of having five different (albeit onedimensional) survey metrics that can fool you – and cost a lot of money.
The easiest way to present this to stakeholders is to take a look at three possible outcomes:
- If you don’t test your advertising, you still have to rely on guesswork to asses what exactly worked (or flunked). Like the father of advertising, pioneering marketer John Wanamaker once said: “Half the money I spend on advertising is wasted; the trouble is I don’t know which half.”
- If you run testing, but use surveys alone, you’ll only waste 35% of your budget (or this means that your effective budget increases by 30%)*
- If you test with surveys AND behavioral methods, you’ll only waste 20% of your budget (or this means that your effective budget increases by 60%)*
To summarize: behavioral and conscious variables are correlated within each group. However, they don’t necessarily correlate with each other. They measure different variables that complement each other and provide a big picture of your ad or product, thus enabling you to predict its effectiveness much better.
Want to learn more about the highest predictive value of different methods? Read our perspective, or reach out at info@eyesee-research.com.
*Our best estimates of various method efficiency using multiple validation sources.