This last winter, COVID burned through the US, flaring to over seventy deaths per million per week — ten times more deaths than a bad year of the Flu at that time of year — twenty times more than a typical year of influenza. COVID killed at more than twice the rate of heart attacks or cancer making COVID the #1 killer in the US by a wide margin. Overall, life expectancy in the US took the biggest hit since World War II. By my calculations, COVID erased $5.2 Trillion in economic value from the economy. Sadly, COVID deaths were exactly as bad as my model predicted (Research World) it would be.
Today, just as the model predicted, vaccinations have put downward pressure of COVID, and the death rate has receded to claiming just five deaths per million per week — about twice as many as a bad year of the flu for this time of year. Vaccines have saved lives and livelihoods. The aggregate economic value of vaccinations, based on my calculations, will be $6.5 Trillion over the next year.
There are plenty of reasons to celebrate this fourth of July. Especially important, the US is trending toward my model’s best case scenario in terms of vaccinating those 65 and older. This is important because 65+ accounted for 80% of the COVID-19 deaths in 2020. To date, 78% of US adults 65+ have been fully vaccinated. Overall, nearly half of the US has been fully vaccinated, and nearly 70% of adults have received one of both doses. The model calculates that for approximately every 300 people that are vaccinated a COVID-19 death is averted. In July, we project the US will cross the point where vaccinations have saved more lives (averted more deaths) than were lost to the virus. With more people vaccinated each day, we are winning the battle against COVID.
Yet, I write today with a warning straight from the same model that has accurately predicted every month to date. The warning: Winter is coming.
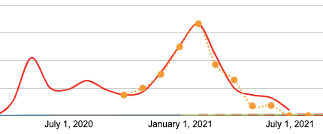
Chart: COVID-19 Deaths Per Million Per Week, US

Legend: Orange Dots = Briggs-3 Monthly Forecast; Red Line = COVID-19 reported deaths
The model has been remarkably accurate in forecasting the trajectory of COVID. For the eighth month in a row, both the one month and three month forecast are within range. The model forecasted the actual number of deaths within 9%, and the three month by just 5%. This is even better than the COVID Forecasting Hub ensemble model used by the CDC, which was off by more than 20% for their 28 day forecast ending on June 26th, and the broadly cited IHME one month forecast, which was off by 11% and the IHME three month forecast, which was off by 8%.
Given the consistent accuracy of the model, maybe we should consider what the model is showing us in terms of the forecasted future for this Winter.
For all the progress we see, the model reveals that over 1,000 counties in the US have a vaccination rate of less than one-third of the population. The model shows that those not vaccinated are experiencing the exact same number of deaths per million as experienced this time last year. The model predicts that unless vaccination rates change in these counties significantly, these counties will experience a similar skyrocketing death toll starting in about 100 days from now.

To be clear, I am not saying those who are vaccinated will experience this same rate of deaths. In fact, overall, due to continued vaccinations, we will see the death rate flat to declining overall. Look closer at those not vaccinated, and it’s a different story. Play the model forward 100 days, to winter, and you see the death rate among those not vaccinated climb once again. How do we avoid this outcome?
Media, business, local government and individual citizens can all make a positive difference.
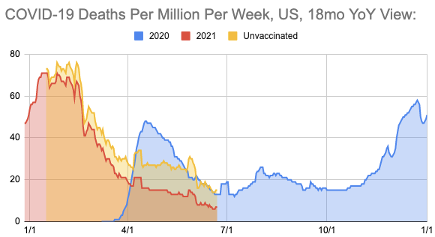
The media can focus on the distinction between the progress for those vaccinated and the continued risks for those not vaccinated. By reporting deaths among unvaccinated, we call attention to the risk (see Chart above. A downloadable version, updated daily, is available at www.speakerrex.com).
The chart shows that comparing deaths of the unvaccinated from this year to last year, we see that the pattern is nearly identical. By reporting this trend, and looking ahead into November and December, more may recognize that the summer lull can be followed by a winter surge. By getting vaccinated, they can protect themselves and those around them.
When reporting on adverse events, the media can contextualize risk of COVID compared to the extremely remote risk from vaccinations. The J&J pause was the moment that vaccination rates began to slow in the US. Perhaps if it was contextualized that the risk of dying of COVID was more than 100 times greater than the VAERS reported risk from the J&J vaccine for the population in question, some may not have been dissuaded from vaccination. In some media, and especially in social media, misinformation abounds. The facts are the vaccines have proven to be both safe and effective. Considering the past year, the risk of dying from COVID-19 has been more than 1,000 times greater than the risk of death from the vaccines. It is important that vaccination risks are contextualized side-by-side to the risk of COVID-19 death or severe COVID outcome.
Businesses can make a significant difference. If you are a business leader that influences policy, consider taking a clear stand in favor of a vaccinated workforce. Bring in health experts to answer questions from those not yet vaccinated. It is in the economic interest of a business to have a healthy workforce, safe working environment, and not to be a source of outbreak for customers.
Local government, county health departments and state immunization efforts have made a positive impact to date, and there is a lot more that can be done. Counties with lower vaccination rates can work with the Ad Council to promote pop-up clinics, talk-to-a-doctor events, contests and local incentives. The Ad Council is using my model to deliver additional health messages into these communities. Now is the time for creative outreach in the community.
As individuals, we likely have a family member or friend who isn’t vaccinated yet. Perhaps they live in one of the counties with an overall low vaccination rate (check out my monthly local vaccination rate analysis for each state and county). We can make a difference by emphatically reaching out.
The model warns, “Winter is coming.” We have 100 days to get as many people vaccinated as possible. This will not be easy, as we are experiencing the paradox of success. Thanks to vaccination success to date, cases and deaths have declined. Life can once again be celebrated together.
But, it’s a tale of two cities. The success in areas with higher vaccination rates masks the spread of infection, variants and deaths among unvaccinated. The model is revealing the virus to be about 50% more deadly compared to just a few months ago, when considering deaths by age cohort. COVID remains a serious concern, especially in counties with low vaccination rates. We have 100 days to make a difference. We can each make a difference. Now is the time to redouble our efforts.
Appendix:
One & Three Month Forecasts:
The model forecasts an incremental 6,691, ending the 31 days of July with 611,047 reported COVID-19 deaths. This compares to 10,035 for the 30 days in June, and represents a continued decline in COVID-19 deaths consistent with the model’s original predictions.
However, if we factor into the model seasonality, based on last year’s deaths among unvaccinated, then the forecast increases to about 2,000 deaths, to an 9,000 incremental deaths for the month of July, ending above 613,000 deaths at the end of the month.
IHME forecast is different. IHME projects a mere 5,197 incremental deaths by the end of July. COVID Forecasting Hub, is closer to the Briggs-3 model, with 7,794 incremental deaths (1,500 to 1,800 deaths per week, ending July with 612,150 deaths.
Philosophically, a “levers model” is not expected to be 100% right, or right 100% of the time. Rather, it is meant to be an expression of the understanding of the dynamics of the system (represented with math). When we see deviations from what we expect to find based on the model, we can focus on exploring the causes of the deviation. We may gain insights as to why we are seeing a divergence.
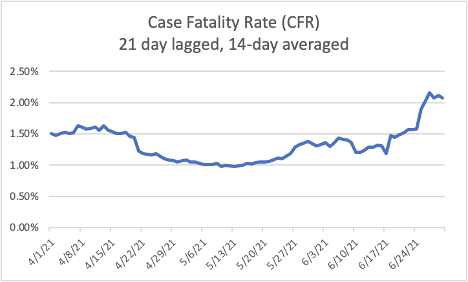
The most significant divergence that is emerging is in the Case Fatality Rate (CFR). CFR should be decreasing over time, as therapeutics get better, and as older people, which accounted for 80% of deaths in the past year, are vaccinated at a very high rate. The CFR averaged 1.7% prior to vaccinations. By examining the vaccination rate by age cohort, the math predicted CFR should fall to 0.9%. While CFR decreased initially, as expected, it has been climbing over the past month. It is now at over 2%.

What might be causing this increase in CFR?
- The end of mask and social distancing mandates meaning people are getting a larger viral load, and that makes death a more likely outcome
- Delta Variant could be more deadly / Therapeutics are less effective
- Those not vaccinated are less healthy (more comorbidities) making for worse outcomes
It could be a combination of all these factors. It could be some unidentified other factor. I am ruling out CFR increasing because of less case detection (only detecting more serious cases) because case positivity rate has not spiked. Whatever the cause, I’ve extended the 2% CFR rate in the model through the end of July and 1.6% through the end of September. A CFR of 2% is the average rate for the last 7 days of June. The trend has been increasing, so 1.6% for August and September may be too optimistic of an assumption. The data on CFR in the model indicates COVID-19 has become more deadly recently and it is unclear the cause, and therefore difficult to predict when it may decline again.
The model forecasts ending September with 620,481 reported COVID deaths. In terms of forecasting vaccination rates, the model is highly accurate in predicting full vaccination rate one month out because those getting the first dose have a high conversion rate to getting the second dose. The original model from November 2020, forecast the US would get to 60% fully vaccinated by Oct 1. When combined with natural recovery, this level of vaccinations would help avoid another winter surge in the US. The current projections of vaccination rates suggest the US may not achieve 60% of the total population fully vaccinated by October 1. The forecast suggests the US will be close, but will come up just shy of the original forecast.
Because the vaccination rate will likely trend below forecast, I am working with the Ad Council and other organizations to close this gap. Whether these efforts will be successful is unknown. I hope to report that we came together to extend vaccination rates and have beat the forecast – but that is my optimism rather than the model prediction.
At the same time, thoughtful people are asking whether it is better to extend vaccinations to those 12 and under in US versus sharing our vaccines with health care workers and those 65 and older in other countries that have not had the opportunity to be vaccinated.
On the other hand, even though the rate of death in those 12 and under is almost nil, this age cohort can be infected and may spread the virus, thus making it difficult to achieve the same level of community immunity protection. As the US approaches COVID-19 deaths around the same range of a bad year of the Flu, I suspect there will be less perceived benefit for someone not yet vaccinated to become vaccinated.
At the same time, now that nearly everyone who wants a vaccine has had an opportunity to have one, the view may be that those that are hospitalized or die of COVID-19 took the risk on their own accord. Considering that Winter is Coming, and will certainly be worse in other parts of the world with lower vaccination rates, perhaps distributing US vaccines to other parts of the world is the best course. The wildcard remains variants and the degree of breakthrough cases and deaths. So far, vaccination appears to be more than 90% effective in decreasing deaths.
For those not vaccinated, Winter is Coming. Currently, the US is among the best positioned to weather the coming storm, but the next 100 days is the time to reach out and engage those you know and care about to take another look. It is far safer to be vaccinated than not.
Next month, I’ll take another look at Europe, which has been trending about six weeks behind the US in terms of vaccinations, and revisit the CFR and the impact of variants.


