By Michalis Michael
Not all product categories are created equal when it comes to sentiment on social media; some enjoy the admiration of their customers, and some have to deal with their wrath on a constant basis.
We probably need to clarify at this point that when we say “Social Media”, we define it in its broadest possible meaning, i.e. apart from Twitter/Facebook (fan pages)/Instagram/YouTube, we can also harvest from millions of public websites where relevant posts are found, such as:
- Blogs
- Fora
- News
- Review Sites
- Other
Now that this is established let’s have a look at some high level quantification of the zillions of posts that are available to us on the web: the ultimate definition of unstructured data. It looks like we may be able to draw some conclusions about some product categories that have been monitored in a number of different countries/languages including The UK, The Netherlands, Poland, China, Colombia, Peru, Ecuador, and a couple that were monitored globally but only for English posts (Fig.1).
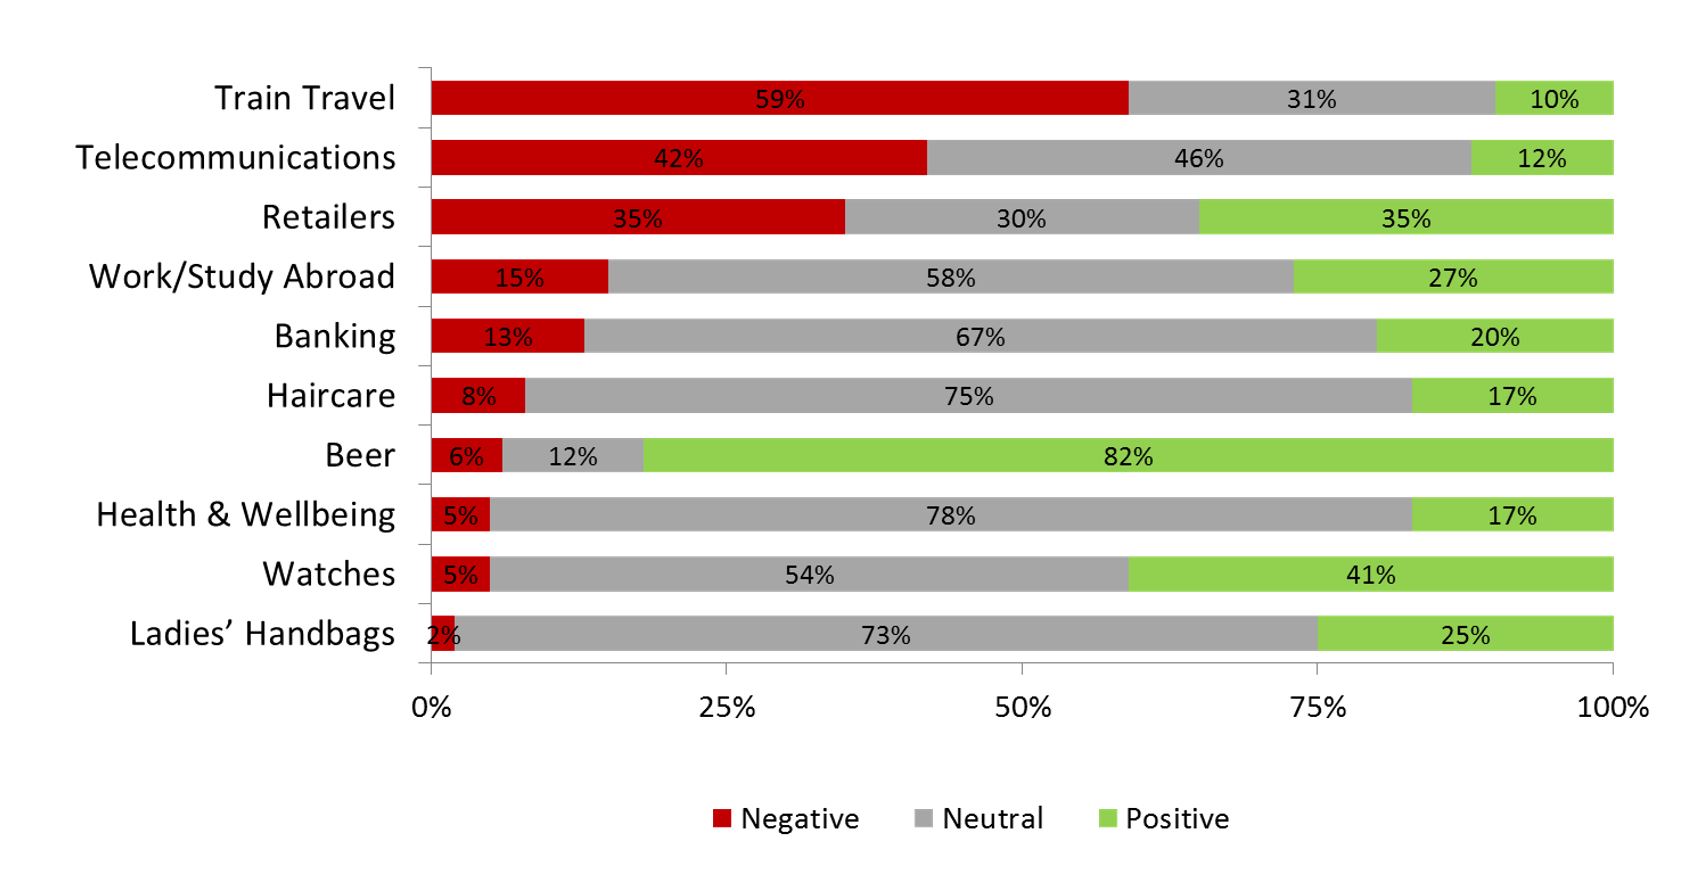
Figure 1: Sentiment at the product category level – Source: listening247
The periods of the data harvesting for the categories in Fig. 1 vary but it is important to know that usually we can access posts on sites from the beginning of time i.e. tweets from 2006, when Twitter started.
Before we continue to address the title of this article, here are some useful tips about social listening reports:
- If a brand is interested in a one-off report to initially understand the social media landscape around itself and its competitors, a sensible approach is to look at 6-12 months of historical data.
- This initial report will define how often it makes sense to track social media posts going forward; the decision usually depends on the number of posts during this period; a subsequent decision about the reporting cycle may range from real-time, to daily, weekly, monthly etc.
- Usually there are fewer posts for B2B brands than there are for B2C so a quarterly cycle for a B2B brand and its competitors is not unusual.
- Another variable that can help a brand decide the reporting cycle is that of their brand tracking survey; it does make a lot of sense to integrate a brand tracker with social listening. Each data collection method provides information in its own right but together, they enable the synthesis of unique insights otherwise unattainable.
Moving from the abstract to the concrete, let’s look at Fig.1 again; which product categories would you prefer to compete in if you had a choice? It looks like service categories such as Train Travel and Telecoms lead the pack in terms of disgruntled customers, with 59% and 42% negative sentiment respectively. On the other end of the spectrum, Handbags enjoy a meagre 2% negative sentiment overall.
In order to have the complete picture we need to look at the share of positive as well as the share of negative sentiment for a product category. The Net Sentiment Score is a trademarked metric that allows us to do so using a single number. In many ways NSS (Net Sentiment Score) is very similar to the (NPS) Net Promoter Score used in surveys.
Even though Handbags enjoy the lowest share of negative sentiment of all categories in Fig.1, just by looking at the chart, we can tell that Beer has the highest Net Sentiment Score due to the high % of positive posts. The ratio of positive vs. negative for Handbags is slightly over 12, whilst the same ratio for Beer is well over 13. Click here to view an infographic report on this comparison.
In the next social media listening article – on March 17th – we will look at a couple of case studies about carbonated soft drinks. Some of you are probably eagerly waiting to find out more about the listening project on the market research industry, so we will aim to share some hard data on the topics and sentiment of the companies included, on March 31st.
Until then, have fun “asking questions”, “tracking behaviour”, and prepare to be impressed by what the third pillar of data collection ,“social media listening”, has to offer.
By Michalis A. Michael, DigitalMR, Connect with Michalis via @DigitalMR, his personal @DigitalMR_CEO or via email mmichael@digital-mr.com

